Climate Change

Frankfooter

dangling member
Apr 10, 2015
91,806
22,230
113
the issue is what you do not understand

anomalies are the change in temperature relative to a reference
larue, the reference is surface temperature.
They are projecting changes (anomalies) in the surface temperature.

Not the temperature in the troposphere.
Are you really unable to understand this?
You're making skoob look clever in comparison.
 

JohnLarue

Well-known member
Jan 19, 2005
17,395
3,061
113
larue, the reference is surface temperature.
They are projecting changes (anomalies) in the surface temperature.

Not the temperature in the troposphere.
Are you really unable to understand this?
You're making skoob look clever in comparison.

they are trying to predict the expected changes in temperature due to the greenhouse gas theory, not the greenhouse surface theory,
you blithering scientific know nothing

explain how an Atmospheric Gas CO2 manages to heat up the surface faster than the Atmosphere ?
be sure to explain how your morons theory obeys the laws of Thermodynamics , the Stephan Law and conservation of energy


1715399837336.png
The failed climate models are an attempt to predict future data via an attempt to code physics theory into a computer program.
Predictions which cant replicate the past -- the minimum requirement of any predictive model - fail
Predictions which do not agree with other models -- fail. There is no way these bozos got the physics theory right when the distribution of Predictions is such a mess
Predictions which do not agree with other confirmed satellite/ weather balloon observations-- fail.

hmm.....independent confirmation vs. failures on multiple levels...... hmm

You're making a corpse look clever in comparison.
 
Last edited:
  • Haha
Reactions: Phil C. McNasty

JohnLarue

Well-known member
Jan 19, 2005
17,395
3,061
113
Has the 'settled science" missed something ?

how will the loonie left tax changes in cloud cover % ?
will there be a parallel Ponzi scheme CCCP rebate ?
(CCCP = Climate Cloud Cover Program
not the CCCP - Climate Change and Carbon Plan, a strategic plan adopted by the Oregon Board of Forestry
and not the evil CCCP Союз Советских Социалистических Республик i.e. commie red, pinko, murderous bastards Union of Soviet Socialist Republics)
oops, I digress

is evil humanity at fault for storing its computer data in the clouds?

1715434770131.jpeg


the IPCC treats cloud cover & reflected solar radiation as a constant
specifying with precision it to a tenth of a W/ m 2 >>>> 101.9 W/m2
http://www.ipcc.ch/publications_and_data/ar4/wg1/en/faq-1-1.html (accessed 6 March 2012).
1715436859938.png


note the net absorbed is the energy imbalance which theoretically is the driver of the hysteria = 0.9 W/ m2
again defined precision to a tenth of a W/ m2

0.9 W/ m2 is miniscule fraction of all the other the energy flows in the earths Energy "Balance"
a miniscule fraction of values they cant get right ??? I do not think so

also note 396 w/m2 outward surface radiation is greater than the 341 w/m2 source incoming solar radiation ??
the law of conservation of energy says that energy is neither created nor destroyed.
the surface is radiating out more energy than the energy provided by the sun at the top of the atmosphere ??? I do not think so

and 396 w/m2 outward surface radiation is more than 2X the 161 w/m2 absorbed by the surface ???
and 333 w/m2 back radiation radiation is more than 2X the 161 w/m2 absorbed by the surface ???

what a bunch of bozos

and to be skeptical gets one labelled / cancelled as a denier ?
 
Last edited:

Frankfooter

dangling member
Apr 10, 2015
91,806
22,230
113
they are trying to predict the expected changes in temperature due to the greenhouse gas theory, not the greenhouse surface theory,
you blithering scientific know nothing
Wow, your ignorance combined with a stubborn refusal to accept facts is constantly shocking larue.
The IPCC is projecting changes in the climate due to increases in greenhouse gases and they are projecting and measuring those changes with global surface temperatures.

Go to the NASA page where they report the Global temperature and read the description of what they measure.
This graph shows the change in global surface temperature compared to the long-term average from 1951 to 1980. Earth’s average surface temperature in 2023 was the warmest on record since recordkeeping began in 1880 (source: NASA/GISS). NASA’s analysis generally matches independent analyses prepared by the National Oceanic and Atmospheric Administration (NOAA) and other research groups. Overall, Earth was about 2.45 degrees Fahrenheit (or about 1.36 degrees Celsius) warmer in 2023 than in the late 19th-century (1850-1900) preindustrial average. The 10 most recent years are the warmest on record.

You keep trying to compare apples to oranges by comparing projections for surface temperature with atmospheric, troposphere measurements.

what is wrong with you?
 

JohnLarue

Well-known member
Jan 19, 2005
17,395
3,061
113
You keep trying to compare apples to oranges by comparing projections for surface temperature with atmospheric, troposphere measurements.
explain how an Atmospheric Gas CO2 manages to heat up the surface faster than the Atmosphere ?
be sure to explain how your morons theory obeys the laws of Thermodynamics , the Stephan Law and conservation of energy

here learn something

1715453702394.png


1715452482851.png
 
Last edited:

Frankfooter

dangling member
Apr 10, 2015
91,806
22,230
113
explain how an Atmospheric Gas CO2 manages to heat up the surface faster than the Atmosphere ?
be sure to explain how your morons theory obeys the laws of Thermodynamics , the Stephan Law and conservation of energy
Again, larue, this is about you repeatedly comparing apples to oranges.
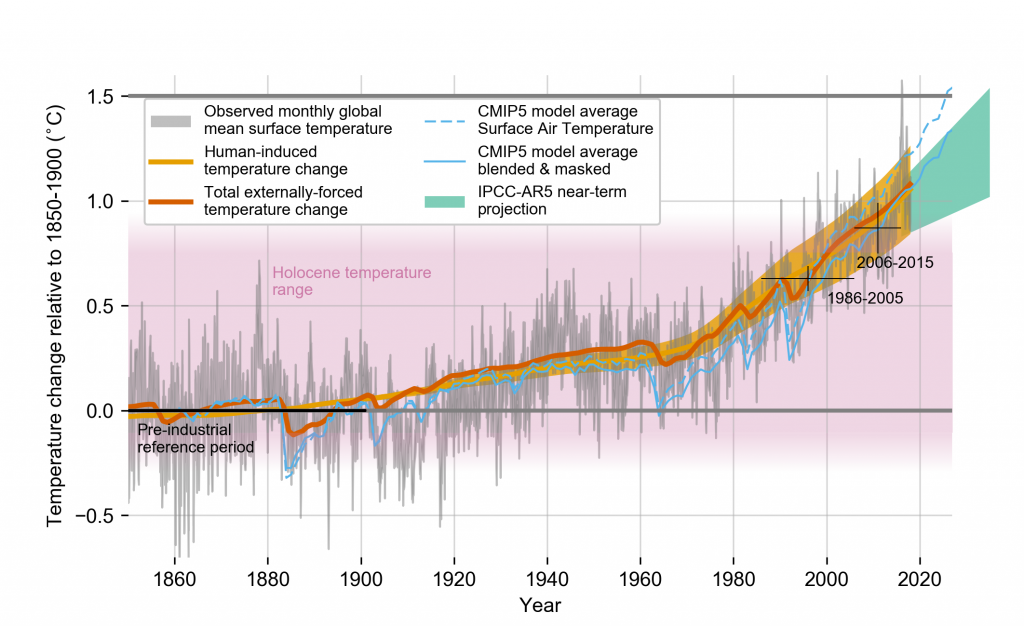
This is from the IPCC projections, note that they talk about surface temperatures, even noting its surface air temperatures.
Not the temperature in the troposphere.

Will you ever admit you are wrong, or will you keep denying this forever?
 

JohnLarue

Well-known member
Jan 19, 2005
17,395
3,061
113
]Again, larue, this is about you repeatedly comparing apples to oranges.
no it is about comparing anomalies
predicted changes in temperature vs observed changes in temperature

since you continue to dodge the question, your view is worthless
(actually your view has negative value..... you know... due to your long comical history of continuous deceit)

explain how an Atmospheric Gas CO2 manages to heat up the surface faster than the Atmosphere ?
be sure to explain how your morons theory obeys the laws of Thermodynamics , the Stephan Law and conservation of energy


1715467576884.png

This is from the IPCC projections, note that they talk about surface temperatures, even noting its surface air temperatures.
Not the temperature in the troposphere.
no it is about comparing anomalies
predicted changes in temperature vs observed changes in temperature

if you had any scientific training you might have understood this.
its not my fault you dropped out of high school
1715468145244.png
 
Last edited:

bver_hunter

Well-known member
Nov 5, 2005
29,333
7,209
113
Remember how people would say that people were dying after getting their covid vax's? It was like anyone who died afterwards for any reason, they believed it was attributed to the vaccine?
Remember that...still goes on to this day.

That's how you guys sound about climate change whenever there's a flood or forest fire.
The righties were making that propaganda about more people dying from the vaccines etc. The vaccines have those microchips that are going to track your every movement by the Deep State. So what is your point?

When we are seeing the scale of the unprecedented fires, floods, tornadoes, hurricanes etc., you guys come up with statements like it is just a cycle and not a big deal. The forest fires were deliberately started etc. etc........ Enough said!!
 

Frankfooter

dangling member
Apr 10, 2015
91,806
22,230
113
no it is about comparing anomalies
predicted changes in temperature vs observed changes in temperature
Its about comparing the changes in temperature on the surface of the planet where humans live instead of in the clouds, where your satellite reads temps.
I'm sure as your HVAC job you had before you retired 30 years ago, you'd be telling customers, that its really warm in their house and they really should take the temperature inside the stove for reference, its way better than using the thermostat.

You're comparing apples to oranges.
Surface temperatures to the temperature in the clouds.

Are you too stupid to understand this or just too dishonest to care?
 

wigglee

Well-known member
Oct 13, 2010
10,365
2,270
113
Good to see the instant karma of wildfires currently threatening Alberta right after Ontario had the warmest winter ever...LOL Yea... big hoax..
 

oil&gas

Well-known member
Apr 16, 2002
13,583
2,100
113
Ghawar
Good to see the instant karma of wildfires currently threatening Alberta right after Ontario had the warmest winter ever...LOL Yea... big hoax..
Sooner or later Newfoundland will be hit as well by Karma in the
form of massive snow storm or tsunami. Drilling in deep water for
polluting oil and gas couldn't be less damaging to Earth's climate
than oil sands extraction.
 

canada-man

Well-known member
Jun 16, 2007
32,057
2,931
113
Toronto, Ontario
canadianmale.wordpress.com
Good to see the instant karma of wildfires currently threatening Alberta right after Ontario had the warmest winter ever...LOL Yea... big hoax..
most wild fires are set by people
 

JohnLarue

Well-known member
Jan 19, 2005
17,395
3,061
113
Good to see the instant karma of wildfires currently threatening Alberta right after Ontario had the warmest winter ever...LOL Yea... big hoax..
the warmest winter ever ?
wrong, ask a geologist

best be sure of what is included or not included in your definition of "ever."
best be sure of what data source is the basis for a claimed new record


GOLDSTEIN: Feds scrapped 100 years of data on climate change
Environment Canada omitted a century’s worth of observed weather data in developing its computer models on the impacts of climate change.

The scrapping of all observed weather data from 1850 to 1949 was necessary, a spokesman for Environment Canada told Blacklock’s Reporter, after researchers concluded that historically, there weren’t enough weather stations to create a reliable data set for that 100-year period.

“The historical data is not observed historical data,” the spokesman said. “It is modelled historical data … 24 models from historical simulations spanning 1950 to 2005 were used.”

since all observed weather data from 1850 to 1949 were deemed unreliable due to limited number of weather stations , all you can claim is that

Ontario had the warmest winter ever. recorded .LOL Yea... big hoax.. since 1950 – Korean War begins.
that is a damn sight short of 'ever'

BTW like so many states/ provinces the record hottest temperature observation for Ontario occurred in the 1930s

42.2 °C (108 °F) Iroquois Falls , 1935
 
Last edited:
  • Like
Reactions: Phil C. McNasty

JohnLarue

Well-known member
Jan 19, 2005
17,395
3,061
113
Again, larue, this is about you repeatedly comparing apples to oranges.
This is from the IPCC projections, note that they talk about surface temperatures, even noting its surface air temperatures.
Not the temperature in the troposphere.
continuously displaying your scientific ignorance is a strange strategy
you might want to re-evaluate

.
For these reasons, large-area summaries incorporate anomalies, not the temperature itself. Anomalies more accurately describe climate variability over larger areas than absolute temperatures do, and they give a frame of reference that allows more meaningful comparisons between locations and more accurate calculations of temperature trends.
https://en.wikipedia.org/wiki/Temperature_anomaly

Temperatures are obtained from surface and offshore weather stations or inferred from meteorological satellite data. Temperature anomalies can be calculated based on datasets of near-surface and upper-air atmospheric temperatures or sea surface temperatures.
there is a lot of comparisons done in science
ever heard of normalization ?
just look for a chart that has more than one line in it, all starting o the same point of the x-axis
you do know what an x-axis is ? , correct ?????

explain how an Atmospheric Gas CO2 manages to heat up the surface faster than the Atmosphere ?
be sure to explain how your morons theory obeys the laws of Thermodynamics , the Stephan Law and conservation of energy

1715520758326.png
 
Last edited:

Frankfooter

dangling member
Apr 10, 2015
91,806
22,230
113
continuously displaying your scientific ignorance is a strange strategy
you might want to re-evaluate

.


https://en.wikipedia.org/wiki/Temperature_anomaly


explain how an Atmospheric Gas CO2 manages to heat up the surface faster than the Atmosphere ?
be sure to explain how your morons theory obeys the laws of Thermodynamics , the Stephan Law and conservation of energy

View attachment 324923
Spoke too soon.

Your link says there are different reports for global temp, from surface to troposphere.
What you link doesn't say is that they are the same and you can compare them as if they were the same.

One other question, larue.
Why does the satellite temperature in your chart stop in 2012 or so?
Why doesn't your chart use the last 10 years of satellite data?
 
Ashley Madison
Toronto Escorts