Dream Spa

Climate Change

JohnLarue

Well-known member
Jan 19, 2005
17,338
2,973
113
Wow, you still can't understand why your chart is bait and switch.
Start with reading the wiki definition of troposphere, where the satellite measures temperature.

Next, compare that with global surface temperatures.

Then see if you can puzzle out why using projections of measurements of the temperature on the surface of the planet shouldn't be compared with measurements of the temperature in the troposphere.
it is astounding how stupid you are

what part of
the troposphere, where the GHG theory predicts the catastrophic warming should take place, but has not taken place
confuses you ?


Then take a look at your last sentence and explain how someone who claims to know or have scientific training could make such a basic error repeatedly, and even after being told countless times.
told countless times by a scientific know nothing with zero scientific training and a pathological desire to lie?
your proposal have been evaluated and rejected due to your history as a high school drop out and inability to be honest

the troposphere, where the GHG theory predicts the catastrophic warming should take place, but has not taken place

there is a reason why Atmospheric scientists choose to look at the Atmosphere rather than look at the ground
there is a reason why Atmospheric scientists have been sending weather balloons up into the Atmosphere for 150 years +

the surface temperature record data is
  1. filled with errors,
  2. contaminated by urban sprawl
  3. incomplete (2/3 of the planet is ocean)
  4. and has been diddled with
you have been told all of this countless times, but refuse to learn

it is astounding how stupid / dishonest you are

1715308094815.png
 
Last edited:

HungSowel

Well-known member
Mar 3, 2017
2,838
1,719
113
it is astounding how stupid you are

what part of

confuses you ?


told countless times by a scientific know nothing with zero scientific training and a pathological desire to lie?
your proposal have been evaluated and rejected due to your history as a high school drop out and inability to be honest

the troposphere, where the GHG theory predicts the catastrophic warming should take place, but has not taken place

there is a reason why Atmospheric scientists choose to look at the Atmosphere rather than look at the ground
there is a reason why Atmospheric scientists have been sending weather balloons up into the Atmosphere for 150 years +

the surface temperature record data is
  1. filled with errors,
  2. contaminated by urban sprawl
  3. incomplete (2/3 of the planet is ocean)
  4. and has been diddled with
you have been told all of this countless times, but refuse to learn

it is astounding how stupid / dishonest you are

View attachment 323925
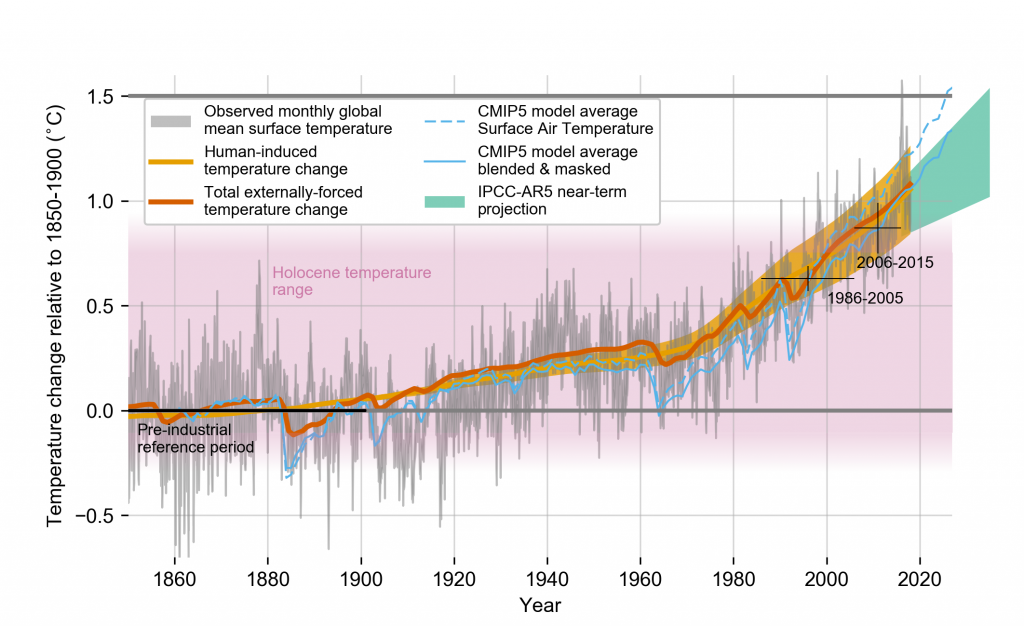
You are comparing predictions of surface temperatures with actual atmosphere temperatures, how does that make any sense?
 
  • Like
Reactions: Frankfooter

Frankfooter

dangling member
Apr 10, 2015
91,866
22,266
113
the troposphere, where the GHG theory predicts the catastrophic warming should take place, but has not taken place
Larue, are you being intentionally dishonest or are you that stupid?
The IPCC projections are for surface temperatures and you want to measure them by the temperatures in the clouds.

Its like in your HVAC job before you retired 40 years ago the clients came to you and said, 'mr johnny, our furnace won't turn off its 45ºC in here' and then you went and said 'don't be silly, I just measured the temperature outside and its 18ºC there, everything is fine'.

As you said:
it is astounding how stupid / dishonest you are
You are comparing apples to oranges.
You are comparing the temperature in the clouds to projections for the temperature on the ground.
what is wrong with you?


JohnLarue

Well-known member
Jan 19, 2005
17,338
2,973
113
You are comparing predictions of surface temperatures with actual atmosphere temperatures, how does that make any sense?
they are not predictions of surface temperatures, they are predictions of temperature anomalies
look at the scale moron
was the average surface temperature 0.1 C in 1980?
was the average troposphere temperature 0.1 C in 1980?

you do not have a clue what you blither about

explain how an atmospheric gas CO2 can heat up the surface without heating up the atmosphere ?
do not forget to include an explanation of how your moron theory obeys the laws of thermodynamics, the Stephan- law and energy conservation


1715311097880.png
 
Last edited:

HungSowel

Well-known member
Mar 3, 2017
2,838
1,719
113
The burden is on me to prove why you can not compare apples with oranges, WTF kind of retardation is this?
 
Last edited:

JohnLarue

Well-known member
Jan 19, 2005
17,338
2,973
113
The burden is on me to prove why you can not compare apples with oranges, WTF kind of retardation is this?
comparing temperature anomalies (change in temperature predicted by the models ) with temperature anomalies (change in temperature- observed by satellite / weather balloon data )
it is called a relative comparison

look at the scale, moron
 
Last edited:

Frankfooter

dangling member
Apr 10, 2015
91,866
22,266
113
comparing temperature anomalies (change in temperature) relative to a different reference

1979 = 0 as per Christy
1979 = looks to be -0.4 as per your fraudster Mann

you do not understand what you post
what a moron
You're doubling down on comparing apples to oranges using faulty old data, larue.
The IPCC projections are for anomalies in surface temperature readings and you keep posting a chart that uses troposphere data.
Not only that, but you only use old data as all new satellite troposphere shows the warming they would expect in the 0-10km of the troposphere.

How can you not understand this?
 

Skoob

Well-known member
Jun 1, 2022
6,827
3,951
113
The information came from a study that sampled thousands of papers, skoob.
Not from the conversation.

How can you get everything wrong so consistently?
The information was mined from documents/citations on that website.
You can stop peddling misinformation now.
 

Frankfooter

dangling member
Apr 10, 2015
91,866
22,266
113
The information was mined from documents/citations on that website.
You can stop peddling misinformation now.
Wrong.
Its amazing how little you understand about academic searches are done, how that paper worked and where that information came from.

You'll love this study too.
 

Skoob

Well-known member
Jun 1, 2022
6,827
3,951
113
True, but very sad indeed. Brazil is going through a very rough time. Several other countries are experiencing their worst effects of this Climate Change.
The right wingers are going from the frying pan into the fire with regards to their very partisan Climate Change views. They just cannot go by the Science!!
Remember how people would say that people were dying after getting their covid vax's? It was like anyone who died afterwards for any reason, they believed it was attributed to the vaccine?
Remember that...still goes on to this day.

That's how you guys sound about climate change whenever there's a flood or forest fire.
 

Skoob

Well-known member
Jun 1, 2022
6,827
3,951
113
Wrong.
Its amazing how little you understand about academic searches are done, how that paper worked and where that information came from.

You'll love this study too.
Wrong.
This info was mined from here:
https://clarivate.com/products/scie...and-workflow-solutions/webofscience-platform/

A for-profit website as I mentioned.

You claimed 99.9% of scientists agree. You are peddling misinformation again. Stop it.
 

Frankfooter

dangling member
Apr 10, 2015
91,866
22,266
113

Skoob

Well-known member
Jun 1, 2022
6,827
3,951
113
Every day your ignorance surprises me in new ways, skoob.
When you do a google search do you then declare that all the results are therefore google?
The info was confined to the contents of that single for-profit web site. Not a global search.

I don't expect a person with a grade school education to actually understand this, so just go have a popsicle and call it a day ok?
 

K Douglas

Half Man Half Amazing
Jan 5, 2005
27,402
8,082
113
Room 112
For the life of me I don't understand why you guys don't have this clown on ignore
I guess I'm a glutton for punishment. Or perhaps I hope that he will one day become rational.
 
  • Like
Reactions: Phil C. McNasty

Frankfooter

dangling member
Apr 10, 2015
91,866
22,266
113
The info was confined to the contents of that single for-profit web site. Not a global search.

I don't expect a person with a grade school education to actually understand this, so just go have a popsicle and call it a day ok?
You do realize that was a service that does global searches for academic papers, don't you?
Its like using google, when it worked, but as a better search engine dedicated to research.

None of the papers were hosted on that site.
 
  • Like
Reactions: bver_hunter

Skoob

Well-known member
Jun 1, 2022
6,827
3,951
113
You do realize that was a service that does global searches for academic papers, don't you?
Its like using google, when it worked, but as a better search engine dedicated to research.

None of the papers were hosted on that site.
Really? Does this sound like a free global search? How do you think data that is "entered by users" gets there if it was a global search like Google?

We are not using any of the LLM API endpoints directly but accessing it from a private space. This ensures that data entered by users in the query will not be accessible to any other party.
https://clarivate.com/products/scie...=Blog&utm_medium=Earned_Press#productfeatures
 

JohnLarue

Well-known member
Jan 19, 2005
17,338
2,973
113
You're doubling down on comparing apples to oranges using faulty old data, larue.
The IPCC projections are for anomalies in surface temperature readings and you keep posting a chart that uses troposphere data.
Not only that, but you only use old data as all new satellite troposphere shows the warming they would expect in the 0-10km of the troposphere.

How can you not understand this?
the issue is what you do not understand

anomalies are the change in temperature relative to a reference
its call a relative comparison and it is used extensively in time series analysis in business and science

have you never seen the consumer price index on a chart ?
gas price data, food price data , furniture price data, rent price data etc. etc. , all pegged to a reference
lots of different types of price data, all pegged to a time reference


explain how an Atmospheric Gas CO2 manages to heat up the surface faster than the Atmosphere ?
be sure to explain how your morons theory obeys the laws of Thermodynamics , the Stephan Law and conservation of energy


Confirmation
The Satellite data are experimental observations confirmed by 4 independent weather balloon data sets,
confirmation deems The Satellite experimental observations to be accurate and reliable

The failed climate models are an attempt to predict future data via an attempt to code physics theory into a computer program.
Predictions which cant replicate the past -- fail
Predictions which do not agree with other models -- fail. There is no way these bozos got the physics theory right when the distribution of Predictions is such a mess
Predictions which do not agree with other confirmed satellite/ weather balloon observations-- fail.

hmm.....independent confirmation vs. failures on multiple levels...... hmm
1715384520910.png

How can you not understand this?

well..........your decision to drop out of high school does explain a lot
 
Last edited:
Ashley Madison
Toronto Escorts