Texas Covid cases going down after relaxing mask law coupled with multiple factors

Phil C. McNasty

Go Jays Go
Dec 27, 2010
27,108
5,232
113

Phil C. McNasty

Go Jays Go
Dec 27, 2010
27,108
5,232
113
See post #15?
Your article is from March 12th, only 2 days after mask laws were relaxed.
The graph and the site in my previous post are much more up to date and accurate

Link: https://www.texastribune.org/2021/03/12/coronavirus-texas-testing/

Love your sig pic selections by the way
There's a trick I use how to find the hottest chicks using google image search, but I dont wanna tell anyone cause I wanna be Terb's sig king ;)
 
  • Haha
Reactions: PeteOsborne

Phil C. McNasty

Go Jays Go
Dec 27, 2010
27,108
5,232
113
Who said anything about herd immunity? Even you must understand that the 6M+ people that have been immunized can no longer become cases. That is close to 25% of the population and has to be a big factor in why cases are trending down
New York also has 25% immunized, and yet their numbers have stayed about the same.
AFAIK they also still have their mask law in effect

Link: https://newyork.cbslocal.com/2021/04/12/covid-vaccine-new-york-25-percent-fully-vaccinated/
Link: https://www.worldometers.info/coronavirus/usa/new-york/
 

PeteOsborne

Kingston recon
Feb 12, 2020
2,157
1,965
113
kingston
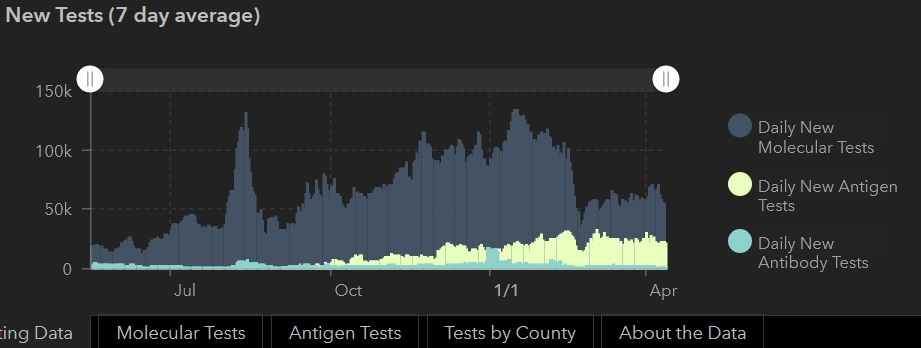
Fair enough, how's this site then?? https://txdshs.maps.arcgis.com/apps/opsdashboard/index.html#/0d8bdf9be927459d9cb11b9eaef6101f

The graph clearly shows testing has remained about the same

I saw this earlier on the Texas dashboard but didn't use it because the scale is large.
But since you posted it, if you look at the far right of the graph the dark blue has dropped indicating less molecular tests, from over approximately 60,000 test per day to about 40,000, the white indicating antigen tests drops, plateaus then drops again, indicating less antigen testing. the light blue is hard to scale but there is a dip about the same time as the others take their initial dip and then plateaus.
There are less tests being done since the beginning of April according to this graph as shown by the height difference between where the dotted line is to the end.
Note that testing dropped drastically in February, I believe it was when the power grid failed and test sites closed down.
 

basketcase

Well-known member
Dec 29, 2005
61,947
6,848
113
...

But if all factors stay the same, and you deduct masks, and the count goes down and not up, you can only draw one conclusion.
...
If all factors stay the same?
Do 15 million doses of the vaccination and reduced testing rate count mean all factors stayed the same?
 
  • Like
Reactions: shakenbake

squeezer

Well-known member
Jan 8, 2010
21,360
16,035
113
No, I'm gonna back up my argument with facts.
And you still havent answered me as to what factors could have led to the decrease in cases for Texas over the last 34 days
More than likely Stooge Abbot is taking a page out of Bullshit Ditantis's book and manipulating the numbers and they are ahead of us on vaccinations. Also you do realize many business are still enforcing mask wearing in Texas right?? One more thing, you are a proponent of lockdowns which Stooge Abbot has done away with. So tell me, have you changed your mind on lockdowns? Do you now believe Ontario and Canada should just open her up, no more masks and let it rip through the population?
 
  • Like
Reactions: shakenbake

Phil C. McNasty

Go Jays Go
Dec 27, 2010
27,108
5,232
113
More than likely Stooge Abbot is taking a page out of Bullshit Ditantis's book and manipulating the numbers and they are ahead of us on vaccinations. Also you do realize many business are still enforcing mask wearing in Texas right?? One more thing, you are a proponent of lockdowns which Stooge Abbot has done away with. So tell me, have you changed your mind on lockdowns? Do you now believe Ontario and Canada should just open her up, no more masks and let it rip through the population?
I have not changed my mind on lockdowns.

My stance on masks also hasnt changed.
Current masks arent working. N95 masks are needed
 

squeezer

Well-known member
Jan 8, 2010
21,360
16,035
113
Are you looking at a different graph than you posted? This one shows a massive drop in tests, especially the molecular tests around the start of March.
I saw this earlier on the Texas dashboard but didn't use it because the scale is large.
But since you posted it, if you look at the far right of the graph the dark blue has dropped indicating less molecular tests, from over approximately 60,000 test per day to about 40,000, the white indicating antigen tests drops, plateaus then drops again, indicating less antigen testing. the light blue is hard to scale but there is a dip about the same time as the others take their initial dip and then plateaus.
There are less tests being done since the beginning of April according to this graph as shown by the height difference between where the dotted line is to the end.
Note that testing dropped drastically in February, I believe it was when the power grid failed and test sites closed down.
The manipulation is obvious but Phil in his zeal to trash mask mandates will bob and weave but usually gets knocked out! LMAO
 
  • Haha
Reactions: mandrill

PeteOsborne

Kingston recon
Feb 12, 2020
2,157
1,965
113
kingston
Your article is from March 12th, only 2 days after mask laws were relaxed.
The graph and the site in my previous post are much more up to date and accurate

Link: https://www.texastribune.org/2021/03/12/coronavirus-texas-testing/
Check the date on the graph in the article, it is April 12th (today is the 13th) showing 77,430 total tests per day which is a definite drop since the beginning of April when the tests per day were around 100,000.
This is all typed of tests combined as well.
Testing has not gone back up to the levels they were at before the power grid failed.
 

Phil C. McNasty

Go Jays Go
Dec 27, 2010
27,108
5,232
113
Are you looking at a different graph than you posted? This one shows a massive drop in tests, especially the molecular tests around the start of March
You are either blind or intentionally obtuse.

Daily new molecular tests show a slight increase.
Daily new antigen tests a slight decrease.
And antibody tests were virtually unchanged


y2kmark

Class of 69...
May 19, 2002
19,045
5,431
113
Lewiston, NY
Is it just schadenfreude on my part or will the world actually be a better place if enough of these anti/vaxers/maskers and defiers of reasonable health precautions die in the end? If Mother Nature is indeed trying to cull the herd, really stupid people should go first...
 

Phil C. McNasty

Go Jays Go
Dec 27, 2010
27,108
5,232
113
Check the date on the graph in the article, it is April 12th (today is the 13th) showing 77,430 total tests per day which is a definite drop since the beginning of April when the tests per day were around 100,000.
This is all typed of tests combined as well.
Testing has not gone back up to the levels they were at before the power grid failed
According to the official Texas Covid-19 site testing hasnt changed much at all, and my graph proves that


basketcase

Well-known member
Dec 29, 2005
61,947
6,848
113
p.s. texas' covid rate has been decreasing since mid-January. I'm sure that phil is saying that decrease happened because two months later Texas stopped mandating masks.
1618359085287.png
 
Toronto Escorts