Only Three Months Left For Planet Earth( and other false doomsday predictions)

Frankfooter

dangling member
Apr 10, 2015
92,846
22,908
113
That sounds rather insulting
Hmm a board without Frankfooter........ Hmmm


The term deniers is also quite insulting, as well completely inappropriate
Trends?
trends does not confirm a theory & that is all you have. Just like a consensus is not a scientific fact
Besides, have you ever stopped for a moment and asked what those graphs look like without the adjustments by Gavin Schmidt/?
The surface data record is a mess, with little or no coverage in the arctic or antarctic i.e where the most warming is suppose to take place
They also do not cover the oceans, a huge problem for a planet which is 2/3 ocean
they also reference the coldest period in hundreds of years as the baseline


Perhaps that is someones theory which you take as fact
Sheepeople
The fact of the matter is Climate is a chaotic turbulent system with far more variables than you can imagine

1, No way in hell these clowns @ IPCC have modeled it correctly
2. No way in hell CO2 in parts per million is the control knob on such a complex system

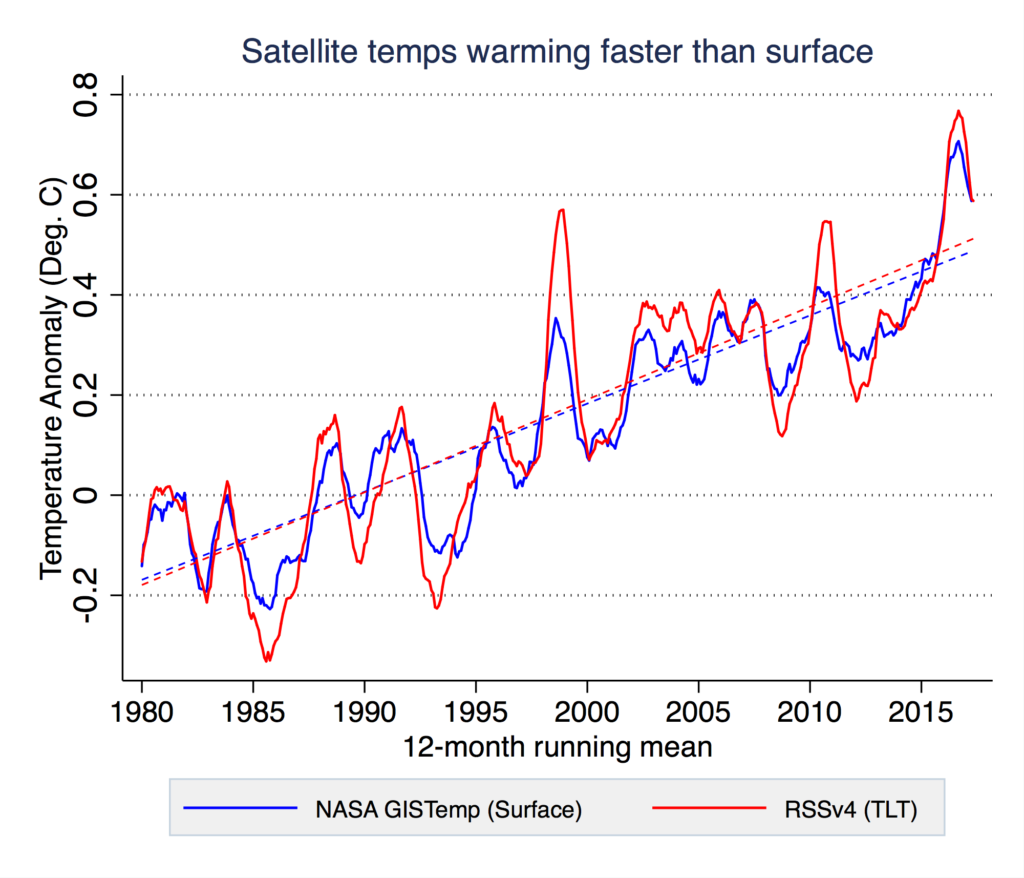
Explain how the surface can be worming faster than the atmosphere genius ?

[IM]
Take it to the mods if you're feeling butthurt, they did say they were thinking of banning complainers.

140 years of data from 5 different sources is hardly 'a trend'.
Accusing Schmidt of altering data when that chart also uses 4 other, non Schmidt, data sources that came to the conclusion just proves your claims about Schmidt are shit.

And then going back to 5 year old, single source, atmospheric charts in a debate about surface temperatures, where the updated charts show the same warming in the atmosphere, show those claims of yours to also be shit.
Your chart contains 30 years of single source, atmospheric data and its out of date.

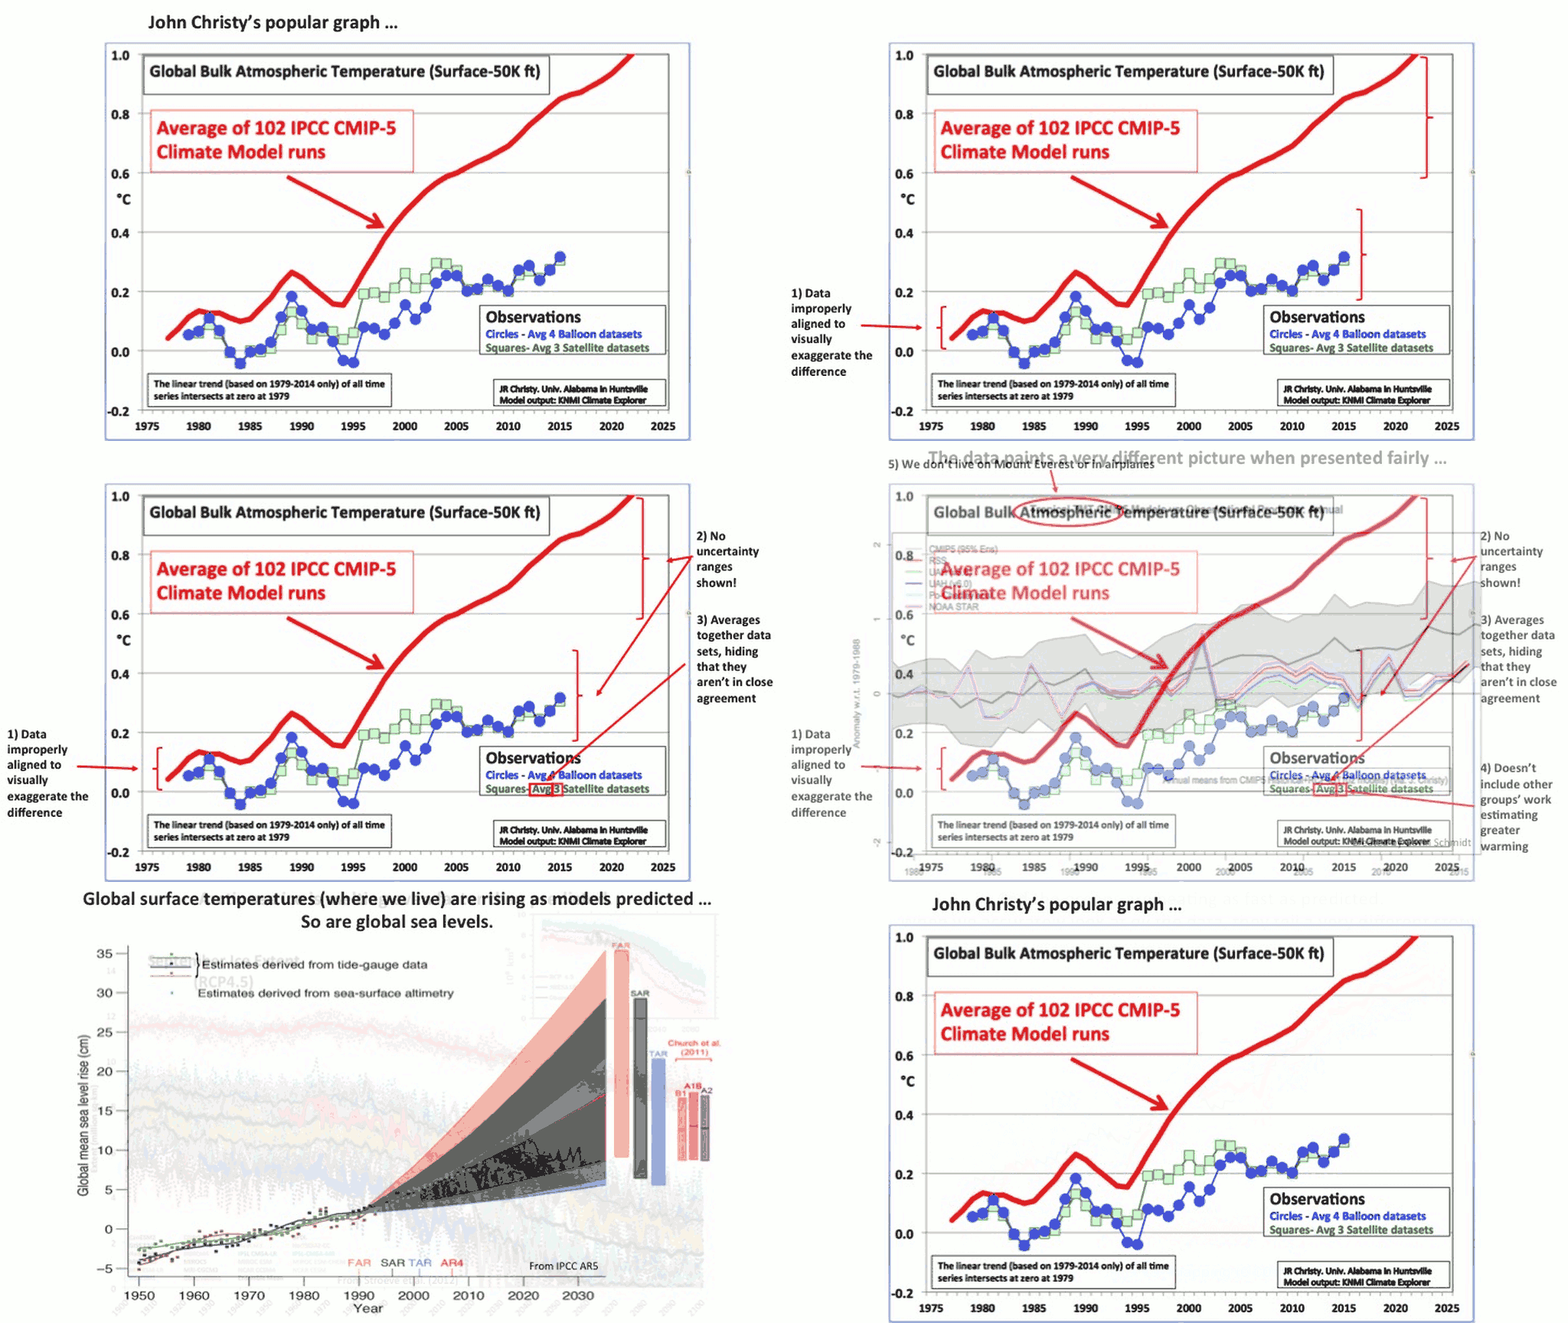
On top of that, the chart contains fatal flaws in how Christy presents the data, as noted here in this article and this annotated version of your chart.
https://www.theguardian.com/environ...orite-climate-chart-has-some-serious-problems


And finally, if you went to Spencer's actual site, which has his updated data, you'd see this:
https://www.drroyspencer.com/latest-global-temperatures/

Spencer's chart shows 1ºC or so warming in the last 35 years or so.
Which agrees with the chart I posted.


Your arguments are bullshit, as usual.
pwned.
 

canada-man

Well-known member
Jun 16, 2007
32,090
2,633
113
Toronto, Ontario
canadianmale.wordpress.com
[h=1]On the Climate Road to Serfdom[/h]
The political world is saying “no” to policies that make energy less available, more expensive, less reliable, and more intrusive. Hyperbole of peak demand is going the way of Peak Oil as the hydrocarbon production boom creates its own demand.
Little wonder that compared to 1988 when global warming became a political issue, U.S. fossil-fuel consumption has grown 13 percent despite generous government subsidies to ethanol, wind power, and solar power.
In fact, growth in carbon-based energies in the last 30 years almost matches the total production of these three subsidized renewables, according to statistics compiled by the U.S. Energy Information Administration.
Overall, the market share of carbon-based energy is a robust 80 percent US and 85 percent globally. This percentage will increase, not decrease, should subsidy fatigue and grassroots pushback against land-intensive solar and wind installations grow.
But rather than check their premises (mineral energies are winning for inherent reasons), climate activists find themselves arguing not only against market capitalism but also democracy and the self-interested preferences of everyday people.
Capitalism is destroying the Earth,” a columnist in The Guardian states. “Ending climate change requires the end of capitalism,” another Guardian piece exclaims. But this is only the beginning.
Edward Luce, US national editor of the Financial Times, opines that “Democracies are ill-suited to deal with climate change.” Harvard University’s Naomi Oreskes recently recommended a media blackout of industry views in favor of those of climate activists.
“The fossil-fuel industry exploited the journalistic ideals of fairness, objectivity and particularly the idea of balance to manipulate journalists into presenting what was essentially propaganda,” Oreskes argues. Censorship is called for.
All previous electronic media – radio, telephone, television – have been regulated. There’s absolutely no reason why this newest form should not be regulated. And people who cry “free speech! free speech!” are ignoring history.
So who would regulate the regulators? Imagine all the lobbying shops in Washington, DC, determining what can be said about climate physics, climate models, and climate economics—and “good” energy and climate policy.
Short of censorship, fooling the public seems to be part of the climate playbook. Climatologist/activist Andrew Dessler tweeted:
Economists love transparency. Rational actors want to know exactly how much everything is costing them so they can make optimal decisions about allocating resources. In politics, though, transparency is a negative. If you open your electricity bill and it says “Carbon tax: $20”, it’s hard to argue that it’s not costing you $20.
A politician can then come along and say, “This $20 tax is killing our economy and costing us jobs — we need to repeal it” and a lot of people will agree. That makes it hard to enact and sustain such a policy.
From a political standpoint, a more opaque policy is actually superior [because] … you have no idea how much it costs. Politicians can argue that it’s costing a lot, but other people can argue the opposite … who’s right?
Opaque policies should be easier to enact and safer once implemented. I think economist’s love of market-based solutions to climate needs to meet the reality of politics.
Can a political candidate or party be honest and open given the pay-now proposition of regulating carbon-dioxide (CO2) emissions? “I don’t know how you talk about it and be truthful and also win votes,” lamented one professor of environmental politics.
Dangerous Worldview
The above goosesteps down the climate road to serfdom is not new. Back in 1954, ecologist Harrison Brown opined:
It seems clear that the first major penalty man will have to pay for his rapid consumption of the earth’s nonrenewable resources will be that of having to live in a world where his thoughts and actions are ever more strongly limited, where social organization has become all pervasive, complex, and inflexible, and where the state completely dominates the actions of the individual.
This quotation, resurrected by Paul and Anne Ehrlich and John Holdren in their 1973 treatise, Human Ecology (p. 388), is but one example of the Malthusian/neo-Malthusian virus that has predicted doom for mankind against the alleged limits to nature for centuries.
A Better View
Free-market wealth-is-health and market anticipation of and adaptation to weather extremes and changing climate, natural or anthropogenic, is the clear direction for energy and climate policy.
Julian Simon noted that “human creation is greater than human destruction, in the sense that our environment is becoming progressively more hospitable to humankind.” Continuing:
The movement away from equilibrium is a movement toward safety and sustenance. The progress carries with it some undesirable features for a while, but eventually we get around to fixing them.
Alex Epstein has also emphasized in The Moral Case for Fossil Fuels (p. 126) how “the popular climate discussion has the issue backward.”
It looks at man as a destructive force for climate livability, one who makes the climate dangerous because we use fossil fuels. In fact, the truth is the exact opposite; we don’t take a safe climate and make it dangerous; we take a dangerous climate and make it safe. High-energy civilization, not climate, is the driver of climate livability.
In fact, the statistics of weather, climate, and general welfare indicate that the world is getting better, not worse, for the great majority of people. Climate-related deaths have fallen precipitously in the last century, a time when atmospheric CO2 concentrations increased by nearly one-third. In terms of general human progress, the last decade was particularly remarkable.
Conclusion
The alarmists are just about out of tricks in their quixotic quest to substitute inferior, stifling energies for better ones—and give government carte blanche in the process.
It is high time to exit the climate road to serfdom. Would-be President Bernie Sanders might be ready to nationalize the energy industry, while climate campaigners lobby to restrict free speech and otherwise try to fool voters. But for civil libertarians, economic conservatives, and classical liberals, exposure, education, and denunciation are in order.

https://wattsupwiththat.com/2020/01/20/on-the-climate-road-to-serfdom/
 

JohnLarue

Well-known member
Jan 19, 2005
17,597
3,181
113
Take it to the mods if you're feeling butthurt, they did say they were thinking of banning complainers.
Your the one who threatened to go to the mods
You insulted someone and called them chicken. Thats insulting by any measure
All i did was ask you a question and put up a picture
Go to the mods or be done with the matter

140 years of data from 5 different sources is hardly 'a trend'.
You are the one who called it a trend
so yeah its a trend & a pile of worthless number if if the theory is flawed/ oversimplified or mishandled and/or misinterpreted
Oversimplified will due for now


Accusing Schmidt of altering data when that chart also uses 4 other, non Schmidt, data sources that came to the conclusion just proves your claims about Schmidt are shit.
I never accused him of anything
All climate scientists make adjustments lots of them, some they have rational arguments for. Apparently it is is part of the job
So if all climate scientists make adjustments as part of their job, then if I state he makes adjustments it is not an accusation
You should take your time & think before responding


It is odd, though how he generally adjust up more in the present time and tends to make more downwards for historical temp data.
Odd how the adjustment tend to match up to his model

And then going back to 5 year old, single source, atmospheric charts in a debate about surface temperatures,
One more time.
1. The surface data is incomplete (Oceans & the two polar regions) and the surface data is a mess
2. Satellite data covers the whole planet
3. The atmosphere is where the greenhouse effect takes place. I suggest you read & learn the theory as you do not get it


where the updated charts show the same warming in the atmosphere, show those claims of yours to also be shit.
Nope, Not as per John christy

Your chart contains 30 years of single source, atmospheric data and its out of date.
Explain how the planet can be warming faster than the atmosphere when the greenhouse effect is occurring in the atmosphere ?
You cant explain that


On top of that, the chart contains fatal flaws in how Christy presents the data, as noted here in this article and this annotated version of your chart.
https://www.theguardian.com/environ...orite-climate-chart-has-some-serious-problems

The guardian?
I guess Pravda is out of print, so you settle for guardian propaganda instead. On a scientific matter no less
Please be serious


And finally, if you went to Spencer's actual site, which has his updated data, you'd see this:
https://www.drroyspencer.com/latest-global-temperatures/
Spencer's chart shows 1ºC or so warming in the last 35 years or so.
Which agrees with the chart I posted.
Your arguments are bullshit, as usual.
pwned.[/QUOTE]

Really?
Bullshit you say
Here is the image. Since when is 0.56 C the one degree you just claimed ?
You had to have seen that number !!! Why the pathological need to lie and mislead?


the climate models are flawed
Climate is likely one of the most complex systems after the human brain. Its chaotic and littered with unpredictable and variable turbulent flows in both the atmosphere and oceans with phase changes as well as dynamic pressure and temperature gradients
And Climate scientists say they have it all modelled out and CO2 controls all of that @ 400 parts per million???????? I do not think so
 

Phil C. McNasty

Go Jays Go
Dec 27, 2010
27,091
5,218
113
^^^ LaRue, just put him on ignore like everyone else has.

I used to debate him but quickly found out he's dishonest in his arguments and just wants to have the last word in every thread.
After a while it just becomes too much typing, and I dont wanna risk Carpal Tunnel syndrome
 

JohnLarue

Well-known member
Jan 19, 2005
17,597
3,181
113
^^^ LaRue, just put him on ignore like everyone else has.

I used to debate him but quickly found out he's dishonest in his arguments and just wants to have the last word in every thread.
After a while it just becomes too much typing, and I dont wanna risk Carpal Tunnel syndrome
I agree, however I will pick and choose my moments

I did not much care for his chicken insult to someone else
 

Moviefan-2

Court Jester
Oct 17, 2011
10,489
172
63
I used to debate him but quickly found out he's dishonest in his arguments and just wants to have the last word in every thread.
Agreed. Although it is fun watching him wet his pants every time a new report is issued that confirms the world is setting new records in man-made carbon emissions and will continue to do so.
 

Frankfooter

dangling member
Apr 10, 2015
92,846
22,908
113
Your the one who threatened to go to the mods
No, you're lying, that was you that threatened the mods.
All I did was warn you that the mods are watching the behaviour you prefer.
I don't report people.


so yeah its a trend & a pile of worthless number if if the theory is flawed/ oversimplified or mishandled and/or misinterpreted
Oversimplified will due for now
That applies to your single sourced chart, not the chart I posted with 5 different sets of numbers over 140 years of data.


I never accused him of anything
Yes you accused him of fudging the data and now that your claim is shown to be bullshit you're trying to backtrack.
Unless you're now accusing every source of global temperature data of fudging the data in exactly the same way....


It is odd, though how he generally adjust up more in the present time and tends to make more downwards for historical temp data.
Odd how the adjustment tend to match up to his model
Conspiracy theory crap, larue.
If you have a theory and evidence, show it.
Otherwise you're rambling with uninformed conspiracy theory crap.


One more time.
1. The surface data is incomplete (Oceans & the two polar regions) and the surface data is a mess
2. Satellite data covers the whole planet
3. The atmosphere is where the greenhouse effect takes place. I suggest you read & learn the theory as you do not get it
1. The surface data is not incomplete, its well calculated to use the data points to represent the full planet.
2. So why did this happen?
Major correction to satellite data shows 140% faster warming since 1998
3. Projections are made for global surface temperatures, trying to bait and switch them with atmospheric temp readings is a lame cheat attempt.


Nope, Not as per John christy
Yes, you've been called on this.
You rely only on one source and only on one single, adjusted and very dated chart.


Explain how the planet can be warming faster than the atmosphere when the greenhouse effect is occurring in the atmosphere ?
You cant explain that
The world’s oceans are the clearest measure of the climate emergency because they absorb more than 90% of the heat trapped by the greenhouse gases emitted by fossil fuel burning, forest destruction and other human activities.


The guardian?
I guess Pravda is out of print, so you settle for guardian propaganda instead. On a scientific matter no less
Please be serious
The Guardian is a legit source.
You failed again.


Really?
Bullshit you say
Here is the image. Since when is 0.56 C the one degree you just claimed ?
You had to have seen that number !!! Why the pathological need to lie and mislead?
Did you fail high school?
Can you not read a chart well enough to see that the chart starts below 0º?
Holy shit, that's sad.


the climate models are flawed
Climate is likely one of the most complex systems after the human brain
Look, just because the science is too hard for you to understand doesn't mean that average and bright people can't grasp it.
Stop projecting your basic lack of science on others who actually know what they are talking about.
Because clearly you don't.

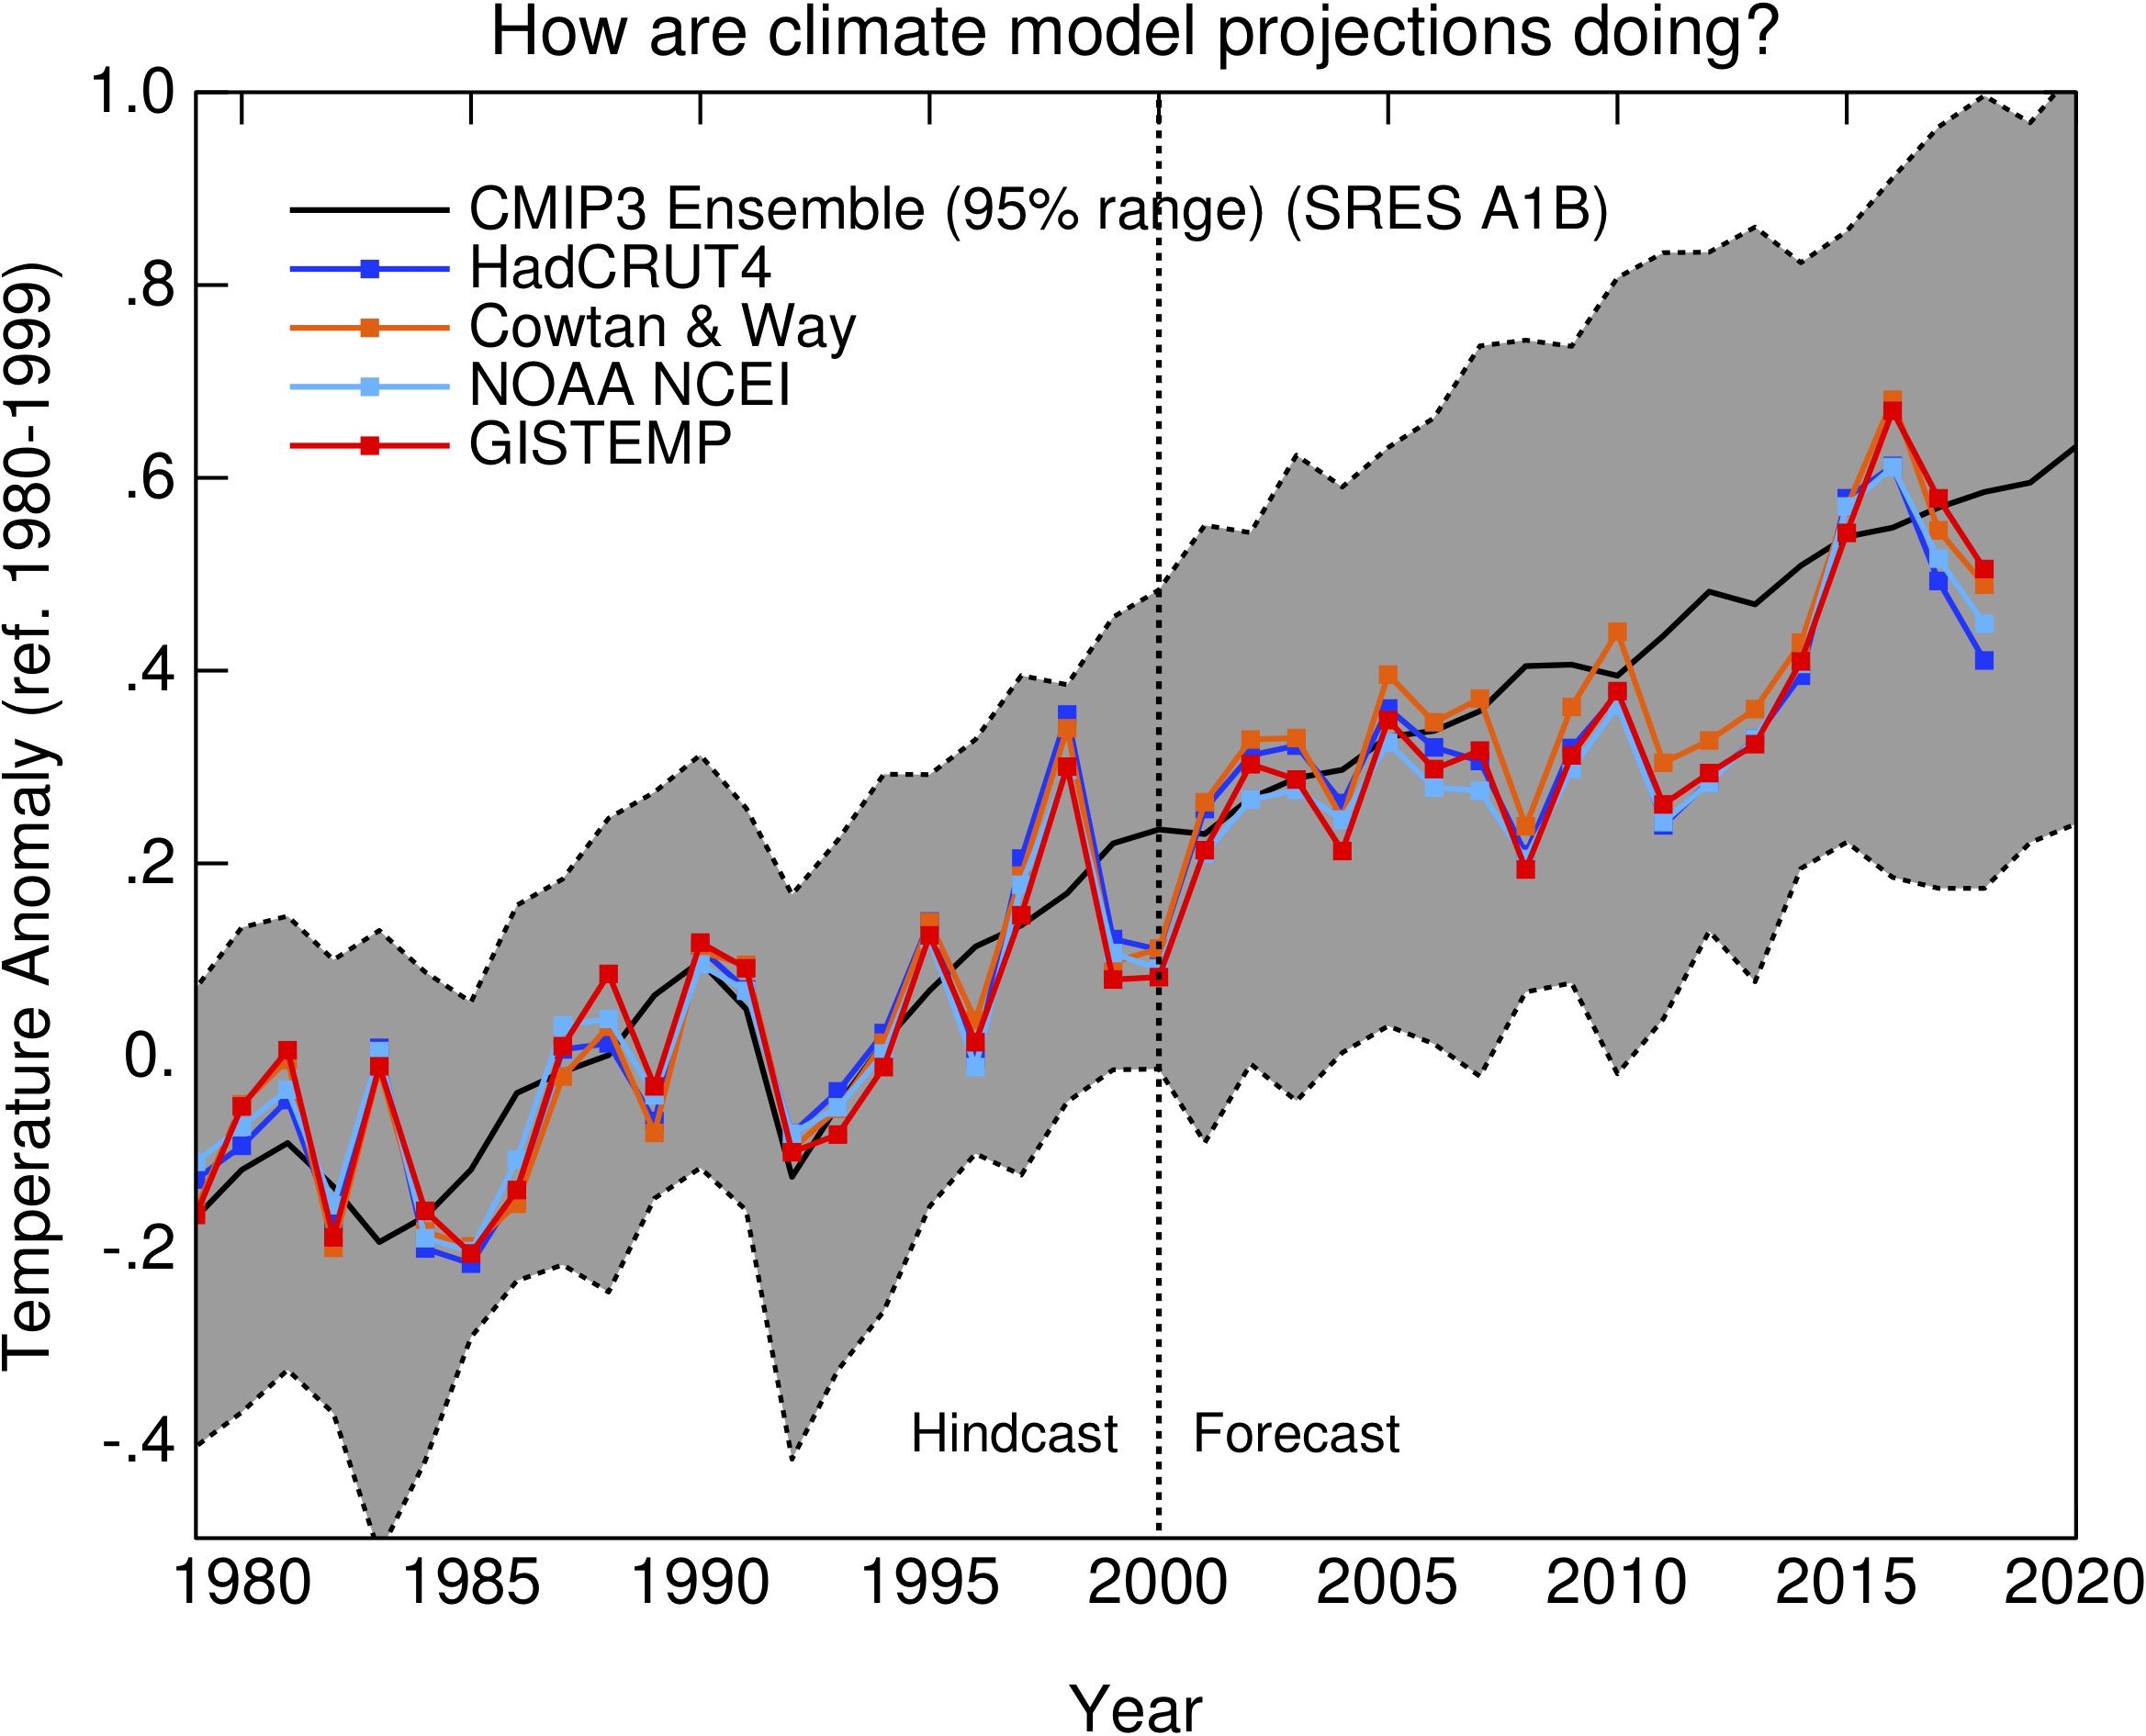
As proof, here's every legit global temperature surface reading measuring vs IPCC climate change projections.
Clearly the IPCC projections are really quite fucking accurate.

Compare that with moviefan, who couldn't even predict one year's temperature increase or phil, who lost so many arguments he had to put me on ignore.
The IPCC is the shit, whereas you and your team are just shitty in comparison.


JohnLarue

Well-known member
Jan 19, 2005
17,597
3,181
113
No, you're lying, that was you that threatened the mods.
All I did was warn you that the mods are watching the behaviour you prefer.
I don't report people.
Wrong


That applies to your single sourced chart, not the chart I posted with 5 different sets of numbers over 140 years of data.
Worthless garbage if f the theory is flawed/ oversimplified or mishandled and/or misinterpreted
Oversimplified will due for now

BTW a 140 years of data ???? & you have climate figured out just enough to predict the end of the world?????? Too Funny
get back to us when you have something impressive


Yes you accused him of fudging the data and now that your claim is shown to be bullshit you're trying to backtrack.
Unless you're now accusing every source of global temperature data of fudging the data in exactly the same way....
Nope I just pointed out he makes adjustments & oddly they just happen to fit his model
Odd how he refuses to debate Roy Spencer

Could it be that he is


Conspiracy theory crap, larue.
If you have a theory and evidence, show it.
Otherwise you're rambling with uninformed conspiracy theory crap.
Time will tell


1. The surface data is not incomplete, its well calculated to use the data points to represent the full planet.
Wake up!
The planet is 2/3 ocean & there are Millions of square miles of the artic & antarctica not covered & never will be.
No urban island heat effect in satalitte data

Carbon Brief ?? Warming 140 times faster Oh Boy
What is wrong with you?????
The link you provided to Roy Spencers Chart shows that is not happening

You have posted two links which are contradictory in less than 48 hrs
you really do not understand what you are posting do you?


3. Projections are made for global surface temperatures, trying to bait and switch them with atmospheric temp readings is a lame cheat attempt.
Perhaps to an uneducated ill-mannered propaganda spinner, however the atmospheric temperature is quite important to anyone who has a grade eight or higher understanding of the Greenhouse Gas theory

Perhaps you might ask your self , where do we find Gases ?
You may also ask yourself why it is called atmospheric carbon dioxide ?

You do understand that the absorption of Infrared radiation occurs in the atmosphere do not you
Explain why it would not be appropriate to measure the temperature thee is you truly believe that is where the heating is occuring?


Yes, you've been called on this.
You rely only on one source and only on one single, adjusted and very dated chart.
Called?
I do not think so. You would had to make an intelligent response in order for me to have been called & we all know that is beyond your current capabilities,
But if you pay attention you might learn something (i tend to doubt it though)


The Guardian is a legit source.
You failed again.
In your dreams


Did you fail high school?
Can you not read a chart well enough to see that the chart starts below 0º?
Holy shit, that's sad.
Too funny
look in the margin of the chart. clearly labeled as Temperature departure from 81-10 Ave (deg C)


How is the six grade education working for you again Jethro?


Look, just because the science is too hard for you to understand doesn't mean that average and bright people can't grasp it.
Stop projecting your basic lack of science on others who actually know what they are talking about.
Because clearly you don't.
Too funny
You are a scientific know nothing, do not understand the physics at all & you prove that on a daily basis
If your motives to deceive were not so despicable it would be funny

As proof, here's every legit global temperature surface reading measuring vs IPCC climate change projections.
Clearly the IPCC projections are really quite fucking accurate.
In your dreams
the climate models are flawed
Climate is likely one of the most complex systems after the human brain. Its chaotic and littered with unpredictable and variable turbulent flows in both the atmosphere and oceans with phase changes as well as dynamic pressure and temperature gradients
And Climate scientists say they have it all modelled out and CO2 controls all of that @ 400 parts per million???????? I do not think so


Compare that with moviefan, who couldn't even predict one year's temperature increase or phil, who lost so many arguments he had to put me on ignore.
He put you on hold because he grew tired of your obnoxious behaviour and tired of your lying
He was not the first, nor will he be hat last to do so

The IPCC is the shit, whereas you and your team are just shitty in comparison.
I would not say the IPCC are shit, I suspect many truly believe in their work, however, it is a political organization and there are some real behavioural issues in climate science, which are going to prove to very detrimental to science & to a lot of people

One thing is glaringly obvious is you do not have the first loose clue about the science and you are the poster boy for why the behavioural issues are such a problem
 

Frankfooter

dangling member
Apr 10, 2015
92,846
22,908
113
Wrong
Worthless garbage if f the theory is flawed/ oversimplified or mishandled and/or misinterpreted
Oversimplified will due for now
BTW a 140 years of data ???? & you have climate figured out just enough to predict the end of the world?????? Too Funny
get back to us when you have something impressive
Nope I just pointed out he makes adjustments & oddly they just happen to fit his model
Odd how he refuses to debate Roy Spence
Could it be that he is

Time will tell
Wake up!
The planet is 2/3 ocean & there are Millions of square miles of the artic & antarctica not covered & never will be.
No urban island heat effect in satalitte data
Carbon Brief ?? Warming 140 times faster Oh Boy
What is wrong with you?????
The link you provided to Roy Spencers Chart shows that is not happening
You have posted two links which are contradictory in less than 48 hrs
you really do not understand what you are posting do you?
Perhaps to an uneducated ill-mannered propaganda spinner, however the atmospheric temperature is quite important to anyone who has a grade eight or higher understanding of the Greenhouse Gas theory
Perhaps you might ask your self , where do we find Gases ?
You may also ask yourself why it is called atmospheric carbon dioxide ?
You do understand that the absorption of Infrared radiation occurs in the atmosphere do not you
Explain why it would not be appropriate to measure the temperature thee is you truly believe that is where the heating is occuring?
Called?
I do not think so. You would had to make an intelligent response in order for me to have been called & we all know that is beyond your current capabilities,
But if you pay attention you might learn something (i tend to doubt it though)
In your dreams
Too funny
look in the margin of the chart. clearly labeled as Temperature departure from 81-10 Ave (deg C)

How is the six grade education working for you again Jethro?
Too funny
You are a scientific know nothing, do not understand the physics at all & you prove that on a daily basis
If your motives to deceive were not so despicable it would be funny
In your dreams
the climate models are flawed
Climate is likely one of the most complex systems after the human brain. Its chaotic and littered with unpredictable and variable turbulent flows in both the atmosphere and oceans with phase changes as well as dynamic pressure and temperature gradients
And Climate scientists say they have it all modelled out and CO2 controls all of that @ 400 parts per million???????? I do not think so
He put you on hold because he grew tired of your obnoxious behaviour and tired of your lying
He was not the first, nor will he be hat last to do so
I would not say the IPCC are shit, I suspect many truly believe in their work, however, it is a political organization and there are some real behavioural issues in climate science, which are going to prove to very detrimental to science & to a lot of people
One thing is glaringly obvious is you do not have the first loose clue about the science and you are the poster boy for why the behavioural issues are such a problem
There is nothing in your post that is worth replying to, larure.
Its just random crap and insults.

So rather than trying to explain why you can't read charts or why your dated, single sourced chart is garbage, why not check these numbers.
They come from a letter signed by 11,000 scientists.
Their letter and the accompanying data are the opposite of your dunning kruger claims.
(all charts referenced from 1979 to the present, same dates as your single, dodgy old chart)


https://academic.oup.com/bioscience/article/70/1/8/5610806
 

JohnLarue

Well-known member
Jan 19, 2005
17,597
3,181
113
There is nothing in your post that is worth replying to, larure.
Its just random crap and insults.
You cant even read / understand a simple temperature anomaly chart & you lecture others on climate?
Get yourself something beyond a grade six level education level before you lie to others and demand they have to change their behaviour because you think you have pseudo science backing you
You do not understand this subject matter at all, but you do have an agenda
 
Last edited:

Frankfooter

dangling member
Apr 10, 2015
92,846
22,908
113
You can even read / understand a simple temperature anomaly chart & you lecture others on climate?
Get yourself something beyond a grade six level education level before you lie to others and demand they have to change their behaviour because you think you have pseudo science backing you
You do not understand this subject matter at all, but you do have an agenda
larue, you're the one who can't read a chart.
First you post an old chart that's been adjusted to make false claims and then when cornered you rely on falsely reading an updated chart.

Take a look at your chart and tell me where that line starts.
Does it start at 0ºC or does it start at -0.3ºC.
When you add that starting point to to the end point to you get 0.56ºC, like you claimed, or is it a higher number?

Tell me if you can do this basic math before we go any further, mr science.


And once you've done that, you need to tell me why you think there is no warming when your own source shows the planet is warming very fast.
Even the wrong number you claim, 0.56ºC, over 40 years shows the planet is warming up as fast or faster than the IPCC predicted.
So why are you still arguing its not happening when even your source shows it is?


canada-man

Well-known member
Jun 16, 2007
32,090
2,633
113
Toronto, Ontario
canadianmale.wordpress.com
Greta Thunberg Incorporated: The Exposé

https://www.youtube.com/watch?v=TTXdhTwO320


Greta didn't attend a regular school. it is a specialized school for kids with mental issues that school don't take attendance


Keean Bexte (January 24, 2020):

Greta Thunberg’s meteoric rise to fame did not happen by accident.

Her canonization as a climate saint was coordinated and executed by a cabal of left-wing eco-elites — including her parents and their famous friends.

But no-one has bothered to dig deep into Greta’s background… Until now.

I flew to Stockholm, Sweden, to watch Greta’s so-called “school strikes” for myself, because I don’t trust the mainstream media narrative that she is the guardian of her own agenda.

But within minutes of appearing at one of Greta’s marches, as I tried to ask her some questions about her protest movement, I was punched in the gut and shoved away by a plain-clothed security guard — in fact, two of them threatened me and told me to “f——k off!”
 

JohnLarue

Well-known member
Jan 19, 2005
17,597
3,181
113
l
arue, you're the one who can't read a chart.
First you post an old chart that's been adjusted to make false claims and then when cornered you rely on falsely reading an updated chart.

Take a look at your chart and tell me where that line starts.
Does it start at 0ºC or does it start at -0.3ºC.
When you add that starting point to to the end point to you get 0.56ºC, like you claimed, or is it a higher number?

Tell me if you can do this basic math before we go any further, mr science.
Oh Boy

I will type this really slow , so that you can keep up

As I mentioned there is a label on the left axis of the chart

It says T ( for tempature) departure from 81-10 Average (Deg C)

The line starts in 1979 and guess what?
That data point in 1979 is below the 1981-2010 Average, that is why it is negative. It departs from the average, which is the zero line and that data point departs downward

The 0.56 Degrees is exactly as labeled as that is the difference from the 30 year average 1981 to 2010. i.e. the horizontal zero line
That is a climate science standard, a thirty year average as the baseline. Ask a climate scientist

Look at the left axis label


Chart reading is grade six or seven level stuff
If you still do not get...... well........?????

Perhaps lecturing others on climate science is not your calling


Have you ever considered propaganda as a vocation?
 

canada-man

Well-known member
Jun 16, 2007
32,090
2,633
113
Toronto, Ontario
canadianmale.wordpress.com
U.S. Government continues to dump funds into an electrical sinkhole

https://wattsupwiththat.com/2020/01...es-to-dump-funds-into-an-electrical-sinkhole/


by Ronald Stein

Founder and Ambassador for Energy & Infrastructure of PTS Advance, headquartered in Irvine, California

When I read the WSJ article “The Best-Laid Energy Plans” about the Government planning and subsidies that were supposedly intended to make America the world’s green-electricity superpower, create millions of jobs, and supercharge the economy, it brings to mind the most terrifying nine words in the English language: ” I’m from the government, and I’m here to help.”

In pursuit of a way to store the daytime intermittent electricity from solar panels, for use when the sun is not shining, the reality is closer to the financial failure at Crescent Dunes, a Nevada solar-energy plant that went gone bust after receiving a $737 million federal loan guarantee. No worries. It’s only taxpayer money,

Crescent Dunes was the first concentrated solar power system that generated solar power by using mirrors or lenses to concentrate a large area of sunlight onto a receiver plant with a central receiver tower and advanced molten salt energy storage technology.

An inconvenient truth is that the sun sets each day, but the Obama Administration’s green planners had an app for that. They decided to invest in the Crescent Dunes facility that would use molten salt to store heat from the sun, produce steam, and generate electricity even at night. Government support would carry the project to sunny success.

Here are all the things that electricity can do for civilization:

· Provide electricity to run the motors of vehicles, heating, air conditioners.

· Provide electricity for lighting

· Provide electricity for electronics

· Provide electricity for the medical infrastructure

Energy storage could revolutionize industries in the next 10 years, but despite the preaching’s about these renewable saviors, it’s becoming obvious that due to their intermittency and unreliability, and their inability to replace any of the chemicals from crude oil that account for the all the products in our daily lives, societies around the world may not be too thrilled about the needed social changes to live on just electricity.

Basically, electricity can power the motors, lights and electronics, but it can’t make the motors, lights and electronics! Even electricity could not exist without fossil fuels as all the parts for wind and solar renewables are made with fossil fuels.

We can be preached to forever about “clean electricity” messages, and bedazzle farmers with the prospects of on-going revenue from renewables, but the extensive mining worldwide for turbine and solar materials, and the decommissioning details, and the social changes that would be necessitated without the thousands of products from those deep earth minerals and fuels, remain the dark side of the unspoken realities of renewables.

Lets’ be clear about what that means. First, it’s not renewable energy, it’s only renewable electricity, and more accurately its only intermittent electricity. Renewables have been the primary driver for residents of Germany, Australia, and California behind the high costs of electricity. Second and most important is, electricity alone is unable to support militaries, aviation, and merchant ships, and all the transportation infrastructure that support commerce around the world.

Everyone knows that electricity is used extensively in residential, commercial, transportation, and the military, to power motors and lite the lights; but it’s the 6,000 products that get manufactured from crude oil that are used to make those motors, lights, and electronics. Noticeable by their absence, from turbines and solar panels, are those crude oil chemicals that renewables are currently incapable of providing.

We’ve had almost 200 years to develop clones or generics to replace the products we get from crude oil such as: medications, electronics, communications, tires, asphalt, fertilizers, military and transportation equipment. The social needs of our materialistic societies are most likely going to remain for all those chemicals that get manufactured out of crude oil, that makes everything that’s part of our daily lifestyles, and for continuous, uninterruptable, and reliable electricity from coal or natural gas generation backup.

Germany tried to step up as a leader on climate change, by phasing out nuclear and fossil fuels, and pioneered a system of subsidies for wind and solar that sparked a global boom in manufacturing those technologies. Today, Germany is failing to meet its climate goals of reducing carbon-dioxide emissions even after spending over $580 billion by 2025 to overhaul its energy systems. Germany’s emissions miss should be a “wake-up call” for governments everywhere.

Power prices in Germany are among the highest in Europe. Today, German households pay almost 50% more for electricity than they did in 2006. Much of that increase in electricity cost is the Renewable Surcharge that has increased over the same period by 770%.


America is taking giant steps toward following Germany’s failed climate goals which should be a wake-up all for governments everywhere, but it appears that America, from California to New York, wants to follow the German failure. Like Germany, America’s renewables are becoming an increasing share in electricity generation, but at a HIGH COST. The emission reduction goals have increased the costs of electricity and transportation fuels and may be very contributory to America’s growing homelessness and poverty populations.

Hopefully, before committing to an all-electric world, we can achieve the technical challenges of discovering a green replacement for the thousands of products based on fossil fuels being provided to every known earth based infrastructure, and society will accept the consequences of altering their lifestyles that will result from less services and more personal input to accommodate losing the advances fossil fuels have afforded them.

Hand the energy economy over to the government in the name of climate change, and there will be countless more Crescent Dunes fiascoes. Alas, brings back again those most terrifying nine words in the English language:” I’m from the government, and I’m here to help.”
 

Frankfooter

dangling member
Apr 10, 2015
92,846
22,908
113
Oh Boy

I will type this really slow , so that you can keep up

As I mentioned there is a label on the left axis of the chart

It says T ( for tempature) departure from 81-10 Average (Deg C)

The line starts in 1979 and guess what?
That data point in 1979 is below the 1981-2010 Average, that is why it is negative. It departs from the average, which is the zero line and that data point departs downward
Yes, mr science, that data point departs downward because it was cooler and the warming has continued through the entire range of your chart.

Now you are arguing that a 0.56ºC warming in 10 years from your 1981-2010 average doesn't show any warming?
And you are arguing that because it uses the average as zero there was no warming during 1981-2010?
So therefore the fact that the chart starts below zero doesn't count?

That's really fucked up attempts at logic larue, you'd fail grade 9 with that thinking.
Your chart shows that there was warming during your 1981-2010 period and that the zero point shows that the warming has continued and is now very similar to warming on the surface.


The 0.56 Degrees is exactly as labeled as that is the difference from the 30 year average 1981 to 2010. i.e. the horizontal zero line
That is a climate science standard, a thirty year average as the baseline. Ask a climate scientist

Look at the left axis label


Chart reading is grade six or seven level stuff
If you still do not get...... well........?????

Perhaps lecturing others on climate science is not your calling


Have you ever considered propaganda as a vocation?
Two simple questions mr science.
1) Do you think that your chart shows no warming during the baseline period, 1981-2010?
2) Why do you accept data that 'departs upwards' at the end of your chart as showing warming but ignore data that 'departs downwards' at the start that shows even more continual warming?

The hilarious, dunning-kruger, part of this debate is that you think you're making winning arguments larue.
 

canada-man

Well-known member
Jun 16, 2007
32,090
2,633
113
Toronto, Ontario
canadianmale.wordpress.com
Welcome to the Extinction Clock. Any time we hear of a credible prediction of doom, we'll be sure to add it to the list!

a website that documenting all doomsday climate predictions and thier failures

https://extinctionclock.org/


https://web.archive.org/web/2008101...wfree-in-13-years-scientists-warn-432596.html

Snowdon will be snow-free in 13 years, scientists warn

By Ian Herbert
Thursday, 18 January 2007

Those who originally named the peak spoke as they probably found it, calling it "Snow Dun", from the Saxon for "snow hill". But Snowdon may lose its snow cover within 13 years as a result of climate change, Welsh scientists say.

Snow has been disappearing for some time from the peak, the highest in Britain south of the Highlands, but the Countryside Council for Wales (CCW) disclosed that this winter's accumulation is the lowest since records began 14 years ago. With only a couple of snowfalls this winter, the total depths measured are way down on previous years and, if the trend continues, any kind of the cover could disappear by 2020.

The loss of snow is already threatening the rare Snowdon lily, a relic of the last ice age, which relies on harsh winters to survive and is losing its habitat to bracken and other plants.

The CCW and the University of Wales, Bangor, plot the snowline - the lowest point at which snow settles - on a daily basis through the nine-month winter period from early September to late May, and compute a total. The highest annual total was 55,000m of snow in the mid 1990s, but the figure fell last year (2005-06) to 24,400 and this year's figure is on course to be substantially lower. The current total is 4,800m of snow, with only just over half of the snow season to run.

The warnings come three months after Scottish scientists warned that their country's ice-capped peaks would become a thing of the past. The average January and February temperatures in the Highlands have been rising by 0.3C every 10 years for the past 30 years. The last snow of last year on Ben Nevis, Britain's highest mountain at 4,406ft (1,343m), disappeared in September.

Dr Clive Walmsley, CCW's climate change adviser, said a September and October entirely free of snow in Wales had contributed to the low figure. "In the last two winters we have seen half the amount of snow recorded in poorest previous years," he said. "This year is dramatically worse than all the rest."

The loss of snow comes at a time when Snowdon is rebuilding its dilapidated visitor centre near the summit. But the absence of snow would also be a symbolic blow, since the snowline is one of the Cardiff Assembly's climate-change indicators for Wales, together with the onset of the first daffodils in bloom. This year, daffodils have been in bloom in the principality since the first week of December.

The First Minister of Wales, Rhodri Morgan, has said that climate change is one of the "three great issues of the next half century." The Assembly discussed the issue of Snowdon yesterday.

Lembit Opik, the leader of the Liberal Democrats in Wales and the MP for Montgomeryshire, said: "Snow-capped Snowdon has been an iconic Welsh image for centuries. It is shocking to think that in just 14 years, snow on this great mountain could become nothing but a permanent and distant memory."

The CCW predicts that the Brecon Beacons, the Black Mountains and the Cambrian Mountains will also be snow-free by 2020.


it is now 2020 and show is still falling in the mountains

http://www.llansadwrn-wx.info/ice/snow.html
 
Toronto Escorts