Can anyone figure out precisely what is predicted based on the abstract of the
linked report?
<<<<<<<<<<<<<<<<<<<<<<<<<<<<<
The Atlantic meridional overturning circulation (AMOC) is a major tipping element in the climate system and a future collapse would have severe impacts on the climate in the North Atlantic region. In recent years weakening in circulation has been reported, but assessments by the Intergovernmental Panel on Climate Change (IPCC), based on the Climate Model Intercomparison Project (CMIP) model simulations suggest that a full collapse is unlikely within the 21st century. Tipping to an undesired state in the climate is, however, a growing concern with increasing greenhouse gas concentrations. Predictions based on observations rely on detecting early-warning signals, primarily an increase in variance (loss of resilience) and increased autocorrelation (critical slowing down), which have recently been reported for the AMOC. Here we provide statistical significance and data-driven estimators for the time of tipping. We estimate a collapse of the AMOC to occur around mid-century under the current scenario of future emissions.
>>>>>>>>>>>>>>>>>>>>>>>>>>>>>>>>>>>>>>>>>>>>>>>>
Just for fun here are more excerpts:
<<<<<<<<<<<<<<<<<<<<<<<<<<<<<<<<<<
A forthcoming collapse of the Atlantic meridional overturning circulation (AMOC) is a major concern as it is one of the most important tipping elements in Earth’s climate system. In recent years, model studies and paleoclimatic reconstructions indicate that the strongest abrupt climate fluctuations, the Dansgaard-Oeschger events, are connected to the bimodal nature of the AMOC. Numerous climate model studies show a hysteresis behavior, where changing a control parameter, typically the freshwater input into the Northern Atlantic,.........................................................................................................
..................................................................................................................................................
In this work, we show that a transition of the AMOC is most likely to occur around 2025-2095 (95% confidence interval).
...................................................................................................
Predicting a forthcoming collapse of the AMOC
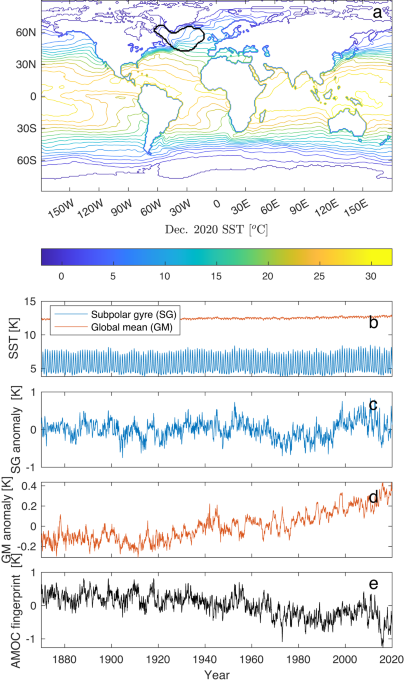
The AMOC fingerprint shown in Fig. 1e (replotted in Fig. 5a) shows an increased variance, γ2, and autocorrelation, ρ, plotted in Fig. 5b, c as functions of the mid-point of a 50-year running window, i.e., the EWS obtained in 2020 is assigned to the year 1995. The estimates leave the confidence band of the baseline values (pink area) around the year 1970. This is not the estimate of t0, which happened earlier and is still to be estimated; it is the year where EWSs are statistically different from baseline values. The estimates after 1970 stay consistently above the upper limit of the confidence interval and show an increasing trend, and we thus conclude that the system is moving toward the tipping point with high probability............................
......................................................................................................
To estimate the tipping time once it has been established that the variance and autocorrelation are increasing, we use two independent methods to check the robustness of our results: (1) Moment-based estimator that uses the variance and autocorrelation..........................................
...............................................................................................................
We have provided a robust statistical analysis to quantify the uncertainty in observed EWSs for a forthcoming critical transition. The confidence depends on how rapidly the system is approaching the tipping point. With this, the significance of the observed EWSs for the AMOC has been established. This is a stronger result than just observing a significant trend in the EWS by, say, Kendall’s τ test. Here we calculate when the EWS are significantly above the natural variations. Furthermore, we have provided a method to not only determine whether a critical transition will happen but also an estimate of when it will happen. We predict with high confidence the tipping to happen as soon as mid-century (2025–2095 is a 95% confidence range). These results are under the assumption that the model is approximately correct, and we, of course, cannot rule out that other mechanisms are at play, and thus, the uncertainty is larger. However, we have reduced the analysis to have as few and sound assumptions as possible, and given the importance of the AMOC for the climate system, we ought not to ignore such clear indicators of an imminent collapse.
The hysteresis simulations gathered in the model intercomparison34 are equilibrium runs, for which a prediction of a future collapse does obviously not apply. Likewise, for the simulations specified in the CMIP6 experiment. It could though be relevant to evaluate our method on state-of-the-art climate model simulations with linearly ramped external forcing and different ramping speeds in order to obtain the model-specific confidence in early prediction of the collapse judged solely from the EWSs.
............................................................................................
Even with these reservations, this is indeed a worrisome result, which should call for fast and effective measures to reduce global greenhouse gas emissions in order to avoid the steady change of the control parameter toward the collapse of the AMOC (i.e., reduce temperature increase and freshwater input through ice melting into the North Atlantic region). As a collapse of the AMOC has strong societal implications38, it is important to monitor the flow and EWS from direct measurements39,40,41.
....................................................................................................
In order to see that this is indeed the case for the AMOC transition also in comprehensive climate models, Fig. 2 is adapted from the model intercomparison study34. The steady state curves obtained are from simulations, with a very slowly changing control parameter (freshwater forcing). The top panel shows ocean-only models, while the bottom panel shows atmosphere-ocean models. The curves are, even away from the transition, surprisingly well fitted by Eq. (13). Note that for some models, the transition happens before the critical point, as should be expected from noise-induced transitions. Note also that the data has been smoothed such that increasing variance close to the transition is not visible. This observation strongly supports the assumption of a saddle-node bifurcation,.............................
>>>>>>>>>>>>>>>>>>>>>>>>>>>>>>>>>>>>>>>>>>>>>>>>>>>>>>>>>>>>
I am a bit disappointed no references are provided in the
report for readers to look up survival skills for the pending
climate collapse.