Fuck it, I'm not wasting all night watching the little coward evade the question.
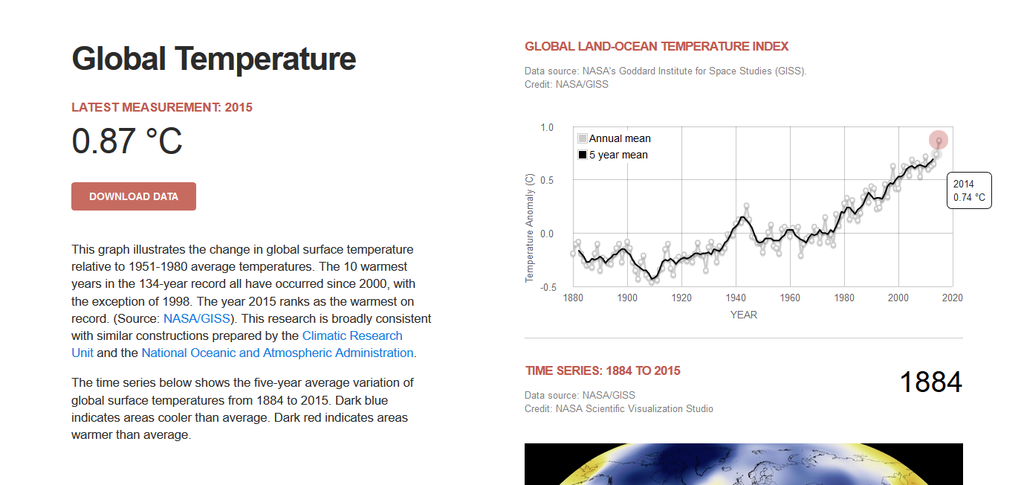
The correct answer is yes, as is seen in Gavin Schmidt's graph below. When you make the appropriate adjustments, the different bodies' thermometer readings of surface temperatures are all similar.
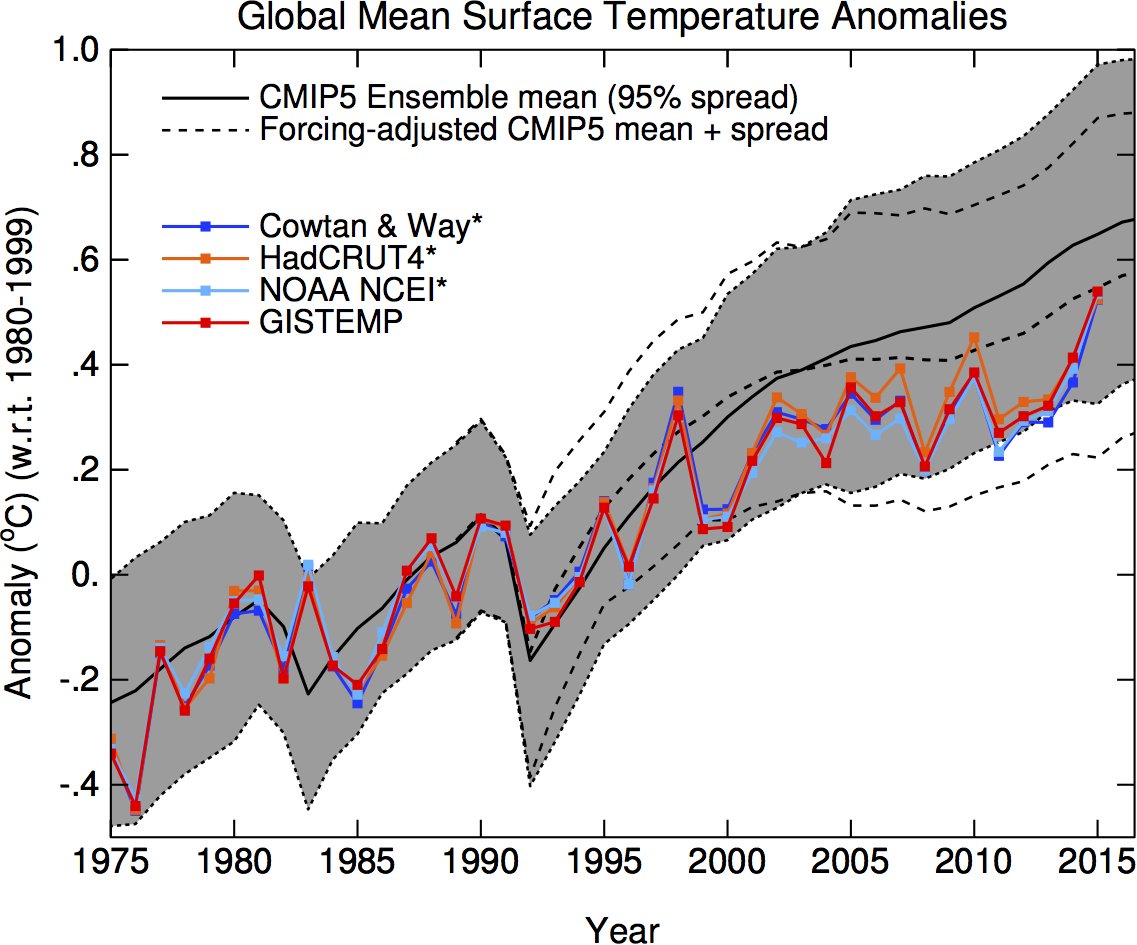
That means that when you use the Met Office's baseline, the reported temperature anomalies for 2015 are all comparable to the 0.745ºC reported by the Met Office.
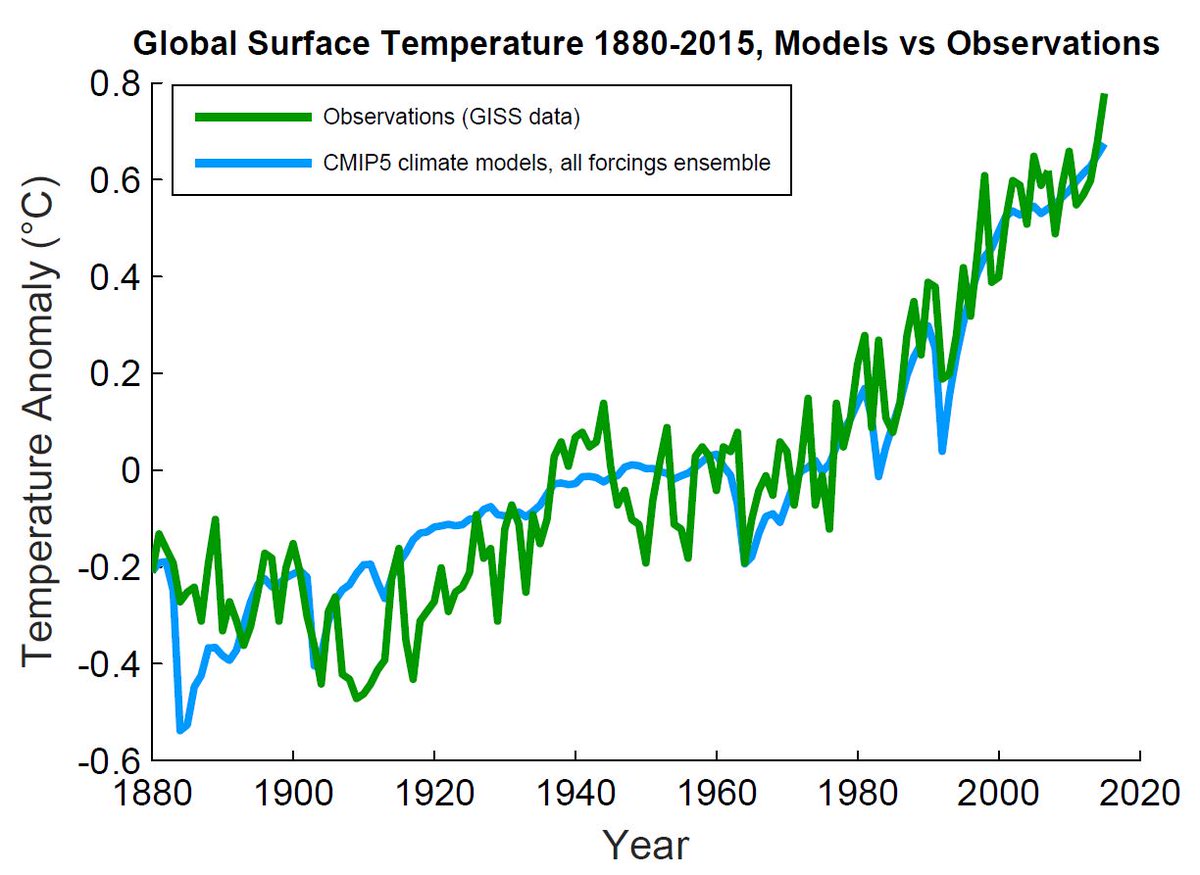
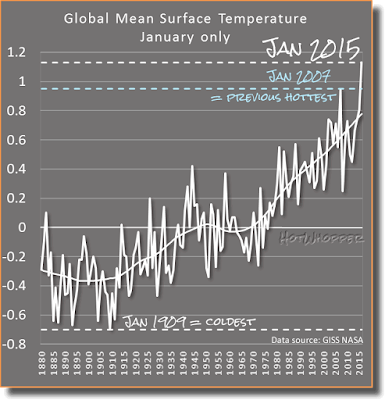
And 0.745ºC is nowhere near the IPCC "projection" of 0.85ºC for 2015 (which was derived from the same 1961-1990 baseline, as shown in the Hotwhopper graph).
http://1.bp.blogspot.com/-rRPfFl2DQ...an+surface+temperature+hadcrut4+and+model.png
Just as I said.
The correct answer is yes, as is seen in Gavin Schmidt's graph below. When you make the appropriate adjustments, the different bodies' thermometer readings of surface temperatures are all similar.
That means that when you use the Met Office's baseline, the reported temperature anomalies for 2015 are all comparable to the 0.745ºC reported by the Met Office.
And 0.745ºC is nowhere near the IPCC "projection" of 0.85ºC for 2015 (which was derived from the same 1961-1990 baseline, as shown in the Hotwhopper graph).
http://1.bp.blogspot.com/-rRPfFl2DQ...an+surface+temperature+hadcrut4+and+model.png
Just as I said.
"Whoops," indeed. :thumb:In fact, the Met Office reported that the HadCRUT4 data showed a final anomaly of 0.745ºC for 2015:
https://crudata.uea.ac.uk/cru/data/temperature/HadCRUT4.pdf
And 0.745ºC is well below 0.85ºC -- proving that Crybaby Frankfooter still doesn't know how to read a graph.