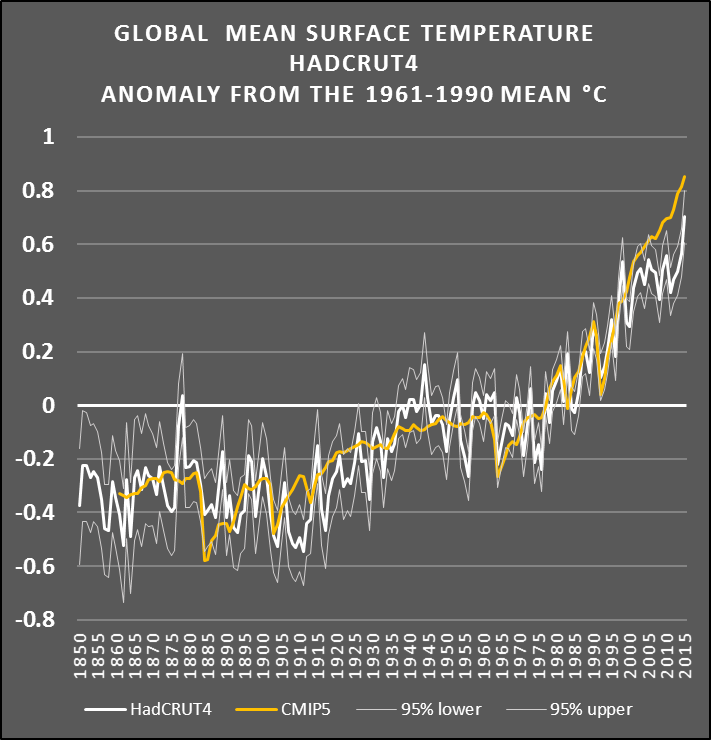
And there he goes again. This time, he's passing off a NASA graph as if it contains the HadCRUT4 data. Unlike NASA, the HadCRUT4 data has the same baseline as the IPCC prediction.
:
Prove it:
What baselines were used for NASA, the IPCC projection you quoted and the MET, and prove that was a different baseline used in the chart I linked.
If you can't, then its clear its you that are lying.
Baselines are really easy to adjust to, its just setting the zero on your graph based on the average temp of a time period, such as 1850-1910, which is used quite often.
Go to this site:
http://www.moyhu.blogspot.com.au/p/climate-plotter.html
There you can plot all the major climate monitors against each other and adjust for whichever baseline period you want to use.
It should be very easy for someone who claims they can read a graph.