


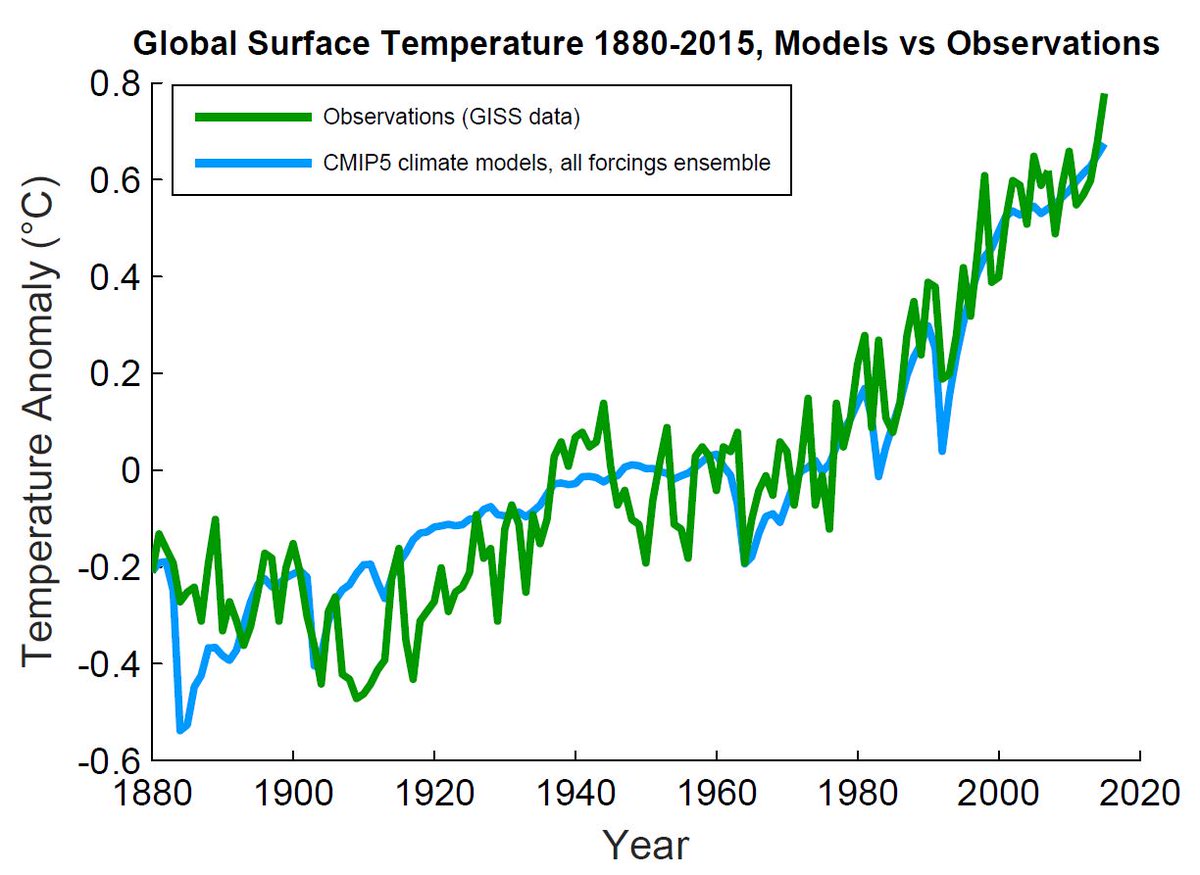
That's CMIP3, idiot. The IPCC's current projections were based on CMIP5.And for full weasel bonus, here's the updated chart from Schmidt, from the same twitter feed link....
Learn to read.
That's CMIP3, idiot. The IPCC's current projections were based on CMIP5.And for full weasel bonus, here's the updated chart from Schmidt, from the same twitter feed link....
That's hilarious coming from a guy who posts a graph of HadCRUT4 data that showed a 0.71ºC anomaly at the end of November (https://terb.cc/vbulletin/showthrea...-HottestYear&p=5410384&viewfull=1#post5410384), and a NASA graph that showed a 0.84ºC anomaly for the end of November (https://terb.cc/vbulletin/showthrea...obal-warming&p=5429576&viewfull=1#post5429576).You really don't understand this subject very well, do you?
Only a denier would quote wattsupwiththat and then claim that they are upset with the 'bastardization of science' by people with a political agenda.???? :crazy:
It's the bastardization of science by people with political agendas that upsets me.
I don't have any faith in NASA's numbers.
Quite a different picture emerges when you actually look at the facts (which, of course, Franky never does).
http://wattsupwiththat.com/2015/12/...o-the-fbi-under-rico-and-wire-fraud-statutes/
You keep claiming that the IPCC projections aren't accurate.That's CMIP3, idiot. The IPCC's current projections were based on CMIP5.
Learn to read.

So, which was it Franky? Was the anomaly at the end of November 0.71ºC or 0.84ºC?Prove it:
What baselines were used for NASA, the IPCC projection you quoted and the MET, and prove that was a different baseline used in the chart I linked.
We've been using NASA numbers for the bet you lost.So, which was it Franky? Was the anomaly at the end of November 0.71ºC or 0.84ºC?
https://terb.cc/vbulletin/showthrea...-HottestYear&p=5410384&viewfull=1#post5410384
https://terb.cc/vbulletin/showthrea...obal-warming&p=5429576&viewfull=1#post5429576
-- We bet that the temperature anomaly would increase in 2015 to 0.83ºC
I have no issue with the data Frankfooter provided.
Coward. I didn't ask you about the bet.We've been using NASA numbers for the bet...
Are you saying the Hotwhopper graph you posted was completely wrong? And, for that matter, that the Met Office's own graphs are completely wrong?Prove it:
What baselines were used for NASA, the IPCC projection you quoted and the MET, and prove that was a different baseline used in the chart I linked.
Coward. I didn't ask you about the bet.
I asked you about your claim that HadCRUT4 and NASA use the same baselines.
As you know from the bet you lost and are acting like a weasel about, NASA stated the anomaly was 0.84ºC with November's data and 0.87ºC for 2015 as the final, bet losing, number.So, which was it Franky? Was the anomaly at the end of November 0.71ºC or 0.84ºC?
The final HadCRUT4 anomaly for 2015 was reported as 0.745ºC.NASA stated the anomaly was 0.84ºC with November's data and 0.87ºC for 2015 as the final....
You are an idiot.The final HadCRUT4 anomaly for 2015 was reported as 0.745ºC.
The Earth only has one temperature. Since you insist they use that NASA and the Met Office use the same baselines, are you saying the Met Office has it completely wrong?
Answer the question.
-- We bet that the temperature anomaly would increase in 2015 to 0.83ºC
Prove it:
What baselines were used for NASA, the IPCC projection you quoted and the MET, and prove that was a different baseline used in the chart I linked.
"Whoops," indeed.NASA's numbers are incredibly close to the MET, as well as incredibly close to NOAA's numbers, when you adjust for the different baselines.
Which is based entirely on his not being able to read, as he claimed a study backed him up on this point despite the findings of the authors saying:To the best of my knowledge, there has never been a survey of climate researchers that has found a consensus on the hypothesis of man-made global warming.
The propaganda papers that you linked to on the NASA page that falsely claim to have found a consensus are based on results that captured a wide range of people, including meteorologists (eg., Doran and Zimmerman, 2009).
When NASA's data is adjusted so that it has a similar baseline to the Met Office, does its anomaly for 2015 come close to the HadCRUT4 anomaly of 0.745ºC?For proof, go to this site:
http://www.moyhu.blogspot.com.au/p/climate-plotter.html
There anybody with half a brain...could compare the different numbers with different baselines.
Proving that you have no idea what baseline is used before you made any accusations."Whoops," indeed.
LMFAO! :biggrin1:
What baseline is used for NASA?LMFAO! Look at the little coward trying to change the subject because he got caught not knowing how to read graphs.
I have a better idea. Let's stay on subject.
When NASA's data is adjusted so that it has a similar baseline to the Met Office, does its anomaly for 2015 come close to the HadCRUT4 anomaly of 0.745ºC?
Yes or no.
You disputed it, as did I:There is no dispute that we bet on a year-over-year increase of at least 0.15ºC.
The bet was based on the IPCC's predictions of temperature increases of 0.2ºC per decade, not numerical changes produced retroactively through changes in methodology.
When NASA's data is adjusted so that it has a similar baseline to the Met Office, does its anomaly for 2015 come close to the HadCRUT4 anomaly of 0.745ºC?For proof, go to this site:
http://www.moyhu.blogspot.com.au/p/climate-plotter.html
There anybody with half a brain...could compare the different numbers with different baselines.
You are really, really stupid.Little coward, don't try to get me to do your homework for you.
Don't you have "half a brain"?
When NASA's data is adjusted so that it has a similar baseline to the Met Office, does its anomaly for 2015 come close to the HadCRUT4 anomaly of 0.745ºC?
Yes or no.
When NASA's data is adjusted so that it has a similar baseline to the Met Office, does its anomaly for 2015 come close to the HadCRUT4 anomaly of 0.745ºC?For proof, go to this site:
http://www.moyhu.blogspot.com.au/p/climate-plotter.html
There anybody with half a brain...could compare the different numbers with different baselines.

