★ Have you made up your mind on climate change, yet?

Moviefan-2

Court Jester
Oct 17, 2011
10,489
171
63
Lets remind you, the only quotes need are the ones that were the bet.
The bet ... was based on continually updated chart posted by NASA at this address:
http://climate.nasa.gov/vital-signs/global-temperature/

It was a year-over-year increase of 0.15ºC of the 2014 anomaly from the time of the bet.
NASA said:
Globally-averaged temperatures in 2015 shattered the previous mark set in 2014 by 0.23 degrees Fahrenheit (0.13 Celsius).

https://www.nasa.gov/press-release/...d-shattering-global-warm-temperatures-in-2015


That's not NASA.
...now you're faking charts.
Yet another lie from you, claiming that's chart we bet on.
Now you're down to copying and pasting random ... quotes as if they had some kind of point to them.
LMFAO! :biggrin1:
 

Frankfooter

dangling member
Apr 10, 2015
91,518
22,161
113
Still acting like a weasel?

You sure are a sucky loser, now all you're doing is wasting space with random irrelevant quotes.
Nothing you've said raises any doubt on who won the bet.

So in order to win the bet, all the temperature has to do is hit 0.83ºC anomaly for the year of 2015, correct?
http://climate.nasa.gov/vital-signs/global-temperature/

If that's the chart you're saying will hit 0.83 at the end of 2015, we definitely have a bet.
Click on the link in the bet above to see who won the bet!

0.87ºC
http://climate.nasa.gov/vital-signs/global-temperature/t
You lost the bet.
Time to pay up.
Stop being a weasel.


You lost the bet.
As loser you must buy these two books, read them and review them here:
http://www.amazon.ca/The-Hockey-Stick-Climate-Wars/dp/0231152558
http://www.amazon.com/gp/product/05...=as2&tag=grlasbl0a-20&linkId=F7NQQFQ4THAO2JDE
 

Moviefan-2

Court Jester
Oct 17, 2011
10,489
171
63
The bet ... was based on continually updated chart posted by NASA at this address:
http://climate.nasa.gov/vital-signs/global-temperature/

It was a year-over-year increase of 0.15ºC of the 2014 anomaly from the time of the bet.
NASA said:
Globally-averaged temperatures in 2015 shattered the previous mark set in 2014 by 0.23 degrees Fahrenheit (0.13 Celsius).

https://www.nasa.gov/press-release/...d-shattering-global-warm-temperatures-in-2015


That's not NASA.
...now you're faking charts.
Yet another lie from you, claiming that's chart we bet on.
...now all you're doing is wasting space with random irrelevant quotes.
Now you're down to copying and pasting random ... quotes as if they had some kind of point to them.
LMFAO! :biggrin1:
 

Frankfooter

dangling member
Apr 10, 2015
91,518
22,161
113

Still putting quotes out of context and still insisting on using non-legit source?
Typical weasel moves.

You really are getting more and more like a weasel.
Just admit you lost the bet.

So in order to win the bet, all the temperature has to do is hit 0.83ºC anomaly for the year of 2015, correct?
http://climate.nasa.gov/vital-signs/global-temperature/

If that's the chart you're saying will hit 0.83 at the end of 2015, we definitely have a bet.
Click on the link in the bet above to see who won the bet!

0.87ºC
http://climate.nasa.gov/vital-signs/global-temperature/t
You lost the bet.
Time to pay up.
Stop being a weasel.


You lost the bet.
As loser you must buy these two books, read them and review them here:
http://www.amazon.ca/The-Hockey-Stick-Climate-Wars/dp/0231152558
http://www.amazon.com/gp/product/05...=as2&tag=grlasbl0a-20&linkId=F7NQQFQ4THAO2JDE
 

Moviefan-2

Court Jester
Oct 17, 2011
10,489
171
63
The bet ... was based on continually updated chart posted by NASA at this address:
http://climate.nasa.gov/vital-signs/global-temperature/

It was a year-over-year increase of 0.15ºC of the 2014 anomaly from the time of the bet.
NASA said:
Globally-averaged temperatures in 2015 shattered the previous mark set in 2014 by 0.23 degrees Fahrenheit (0.13 Celsius).

https://www.nasa.gov/press-release/...d-shattering-global-warm-temperatures-in-2015


That's not NASA.
...now you're faking charts.
Yet another lie from you, claiming that's chart we bet on.
....still insisting on using non-legit source?
Now you're down to copying and pasting random ... quotes as if they had some kind of point to them.
LMFAO! :biggrin1:
 

Frankfooter

dangling member
Apr 10, 2015
91,518
22,161
113

Still putting quotes out of context and still insisting on using non-legit source?
Typical weasel moves.

You really are getting more and more like a weasel.
Just admit you lost the bet.

So in order to win the bet, all the temperature has to do is hit 0.83ºC anomaly for the year of 2015, correct?
http://climate.nasa.gov/vital-signs/global-temperature/

If that's the chart you're saying will hit 0.83 at the end of 2015, we definitely have a bet.
Click on the link in the bet above to see who won the bet!

0.87ºC
http://climate.nasa.gov/vital-signs/global-temperature/t
You lost the bet.
Time to pay up.
Stop being a weasel.


You lost the bet.
As loser you must buy these two books, read them and review them here:
http://www.amazon.ca/The-Hockey-Stick-Climate-Wars/dp/0231152558
http://www.amazon.com/gp/product/05...=as2&tag=grlasbl0a-20&linkId=F7NQQFQ4THAO2JDE
 

Frankfooter

dangling member
Apr 10, 2015
91,518
22,161
113
Moviefan 'whoops' #1:

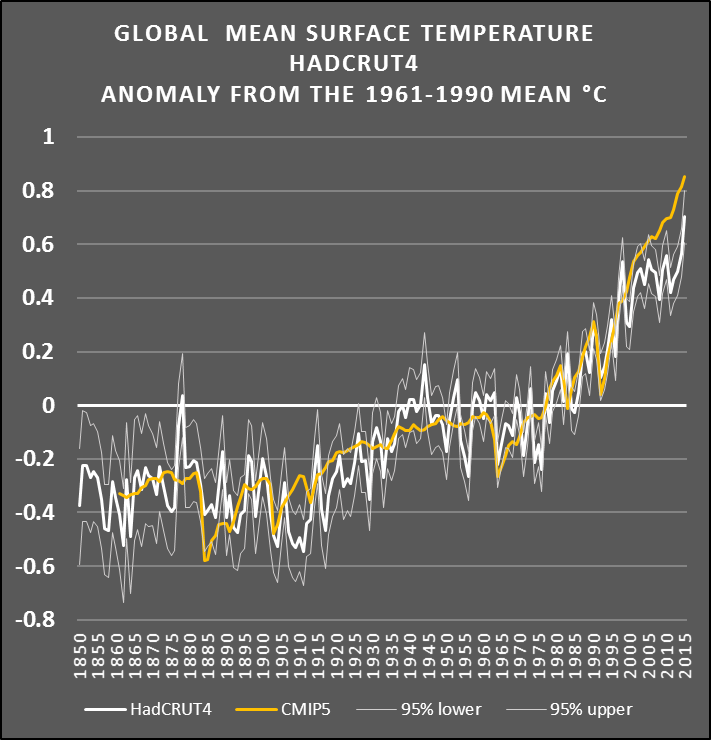
The published sources -- including your source -- has the IPCC "projection" for 2015 at 0.85ºC and the HadCRUT4 anomaly (using the same baseline) in this super El Nino year at just 0.71ºC.

Proving the IPCC's "projections" have been spectacularly wrong.
A moviefan posted image:


Whoops, moviefan proves that the IPCC is spectacularly accurate, posting that 2015 was 0.87ºC after projecting it at 0.85ºC.
 

Moviefan-2

Court Jester
Oct 17, 2011
10,489
171
63
Whoops, moviefan proves that the IPCC is spectacularly accurate, posting that 2015 was 0.87ºC after projecting it at 0.85ºC.
- Dec. 5, 2015 -- Frankfooter posted what he said is a Met Office graph that shows updated HadCRUT4 data: https://terb.cc/vbulletin/showthrea...-HottestYear&p=5416886&viewfull=1#post5416886. In fact, the graph came from Columbia University and uses the entirely different NASA data.
And there he goes again. This time, he's passing off a NASA graph as if it contains the HadCRUT4 data. Unlike NASA, the HadCRUT4 data has the same baseline as the IPCC prediction.

In fact, the Met Office reported that the HadCRUT4 data showed a final anomaly of 0.745ºC for 2015:

https://crudata.uea.ac.uk/cru/data/temperature/HadCRUT4.pdf

And 0.745ºC is well below 0.85ºC -- proving that Crybaby Frankfooter still doesn't know how to read a graph.

"Whoops," indeed. :biggrin1:
 

Frankfooter

dangling member
Apr 10, 2015
91,518
22,161
113
And there he goes again. This time, he's passing off a NASA graph as if it contains the HadCRUT4 data. Unlike NASA, the HadCRUT4 data has the same baseline as the IPCC prediction.
:
Prove it:
What baselines were used for NASA, the IPCC projection you quoted and the MET, and prove that was a different baseline used in the chart I linked.
If you can't, then its clear its you that are lying.


Baselines are really easy to adjust to, its just setting the zero on your graph based on the average temp of a time period, such as 1850-1910, which is used quite often.

Go to this site:
http://www.moyhu.blogspot.com.au/p/climate-plotter.html
There you can plot all the major climate monitors against each other and adjust for whichever baseline period you want to use.

It should be very easy for someone who claims they can read a graph.
 

Frankfooter

dangling member
Apr 10, 2015
91,518
22,161
113
Here's the graph that Frankfooter posted at the end of November that compares the HadCRUT4 data with the "IPCC's projection." At the end of November, the Met Office was reporting the 2015 anomaly as 0.71ºC (it finished the year at 0.745ºC).

"Whoops," indeed. :biggrin1:
Only someone whose a total denier would look at that chart and not admit that reality is following the projections really, really closely.
Here's a more updated chart, also from hotwhopper.com, that gives a clearer picture.


You have to be a total wacko to say those lines aren't very close and following very closely.
 

Frankfooter

dangling member
Apr 10, 2015
91,518
22,161
113
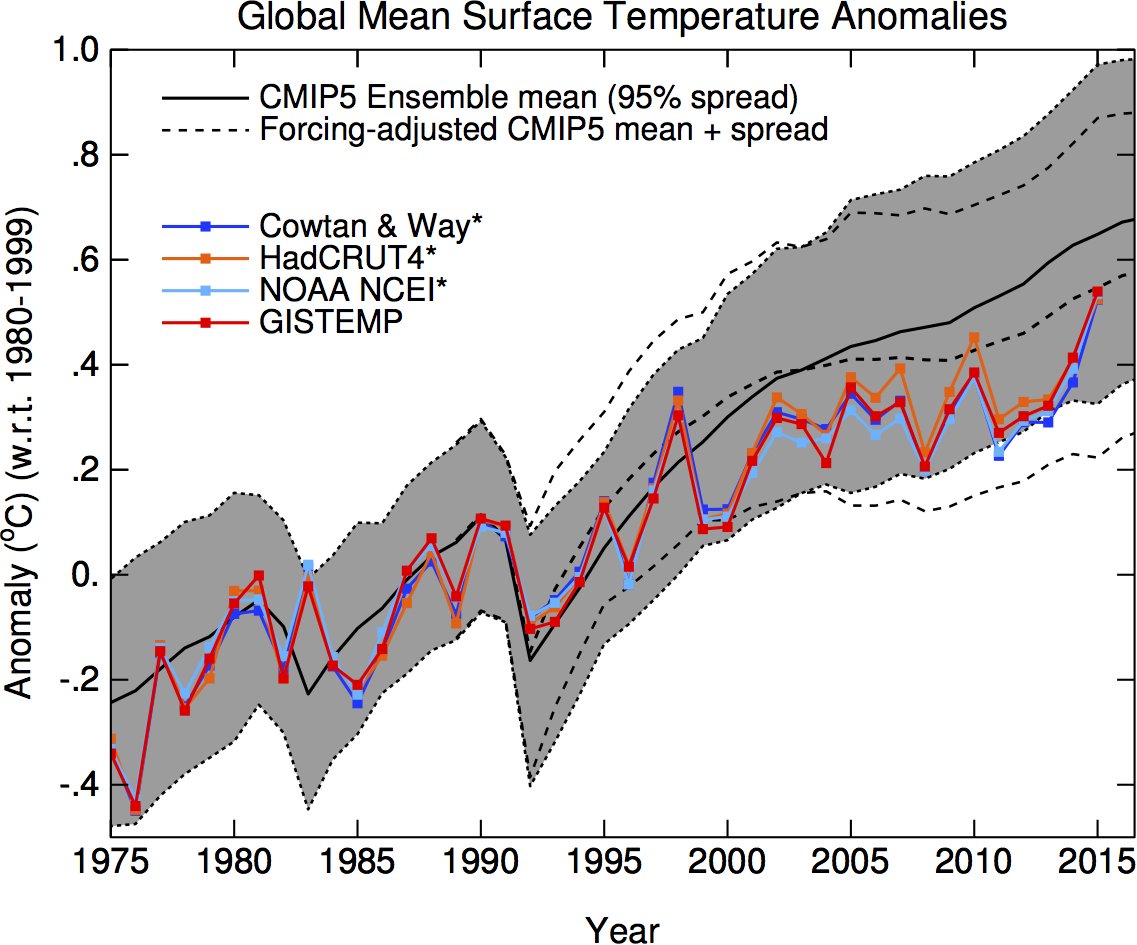
From the "dodgy" Gavin Schmidt on Jan. 20, 2016:


https://twitter.com/ClimateOfGavin/media

The IPCC prediction (the CMIP5 average) is the solid black line.

"Whoops," indeed. :biggrin1:

You're 'big whoops' has the latest data smack dab on the dotted line of the IPCC projections with forcings.
Thanks for proving that you can't read a chart, that chart proves that the IPCC is accurate and you don't know what you are talking about.

That's three different charts from three different sources that all prove that moviefan is full of shit.
Just as he lost the bet on the IPCC projections, now he's posting charts that prove he is wrong and claiming that they prove he is right.

What a weasel.

And for full weasel bonus, here's the updated chart from Schmidt, from the same twitter feed link weaselfan posted.


Moviefan-2

Court Jester
Oct 17, 2011
10,489
171
63
You're 'big whoops' has the latest data smack dab on the dotted line of the IPCC projections with forcings.
The IPCC projection is the solid black line -- the one that says "CMIP5 Ensemble mean".

Idiot.

Try reading from your own Guardian article: http://www.theguardian.com/environm...-right-in-line-with-climate-model-predictions

I don't care about the "updated" changes to the projections that Schmidt is proposing. The IPCC's actual projection remains spectacularly wrong.
 

Frankfooter

dangling member
Apr 10, 2015
91,518
22,161
113
Moviefan 'whoops' #2.

It's the bastardization of science by people with political agendas that upsets me.
And a quote from wattsupwiththat.com to prove that he can't tell bastardization of science when its posted in gobblygook on a fossil fuel funded denier site.

Quite a different picture emerges when you actually look at the facts (which, of course, Franky never does).

http://wattsupwiththat.com/2015/12/...o-the-fbi-under-rico-and-wire-fraud-statutes/
 

Frankfooter

dangling member
Apr 10, 2015
91,518
22,161
113
The IPCC projection is the solid black line -- the one that says "CMIP5 Ensemble mean".

Idiot.
The IPCC projections are made without any natural forcings, like volcanoes, as those things can't be predicted. If you want to to judge how accurate the models are you have to look at how accurately they projected the climate, and to do that you take out the random natural forcings you can't predict, like volcanoes.

Idiot yourself.
You really don't understand this subject very well, do you?
 
Toronto Escorts