LMFAO.
No, my position is that the tables are correct. The problem is that you're not reading them correctly.
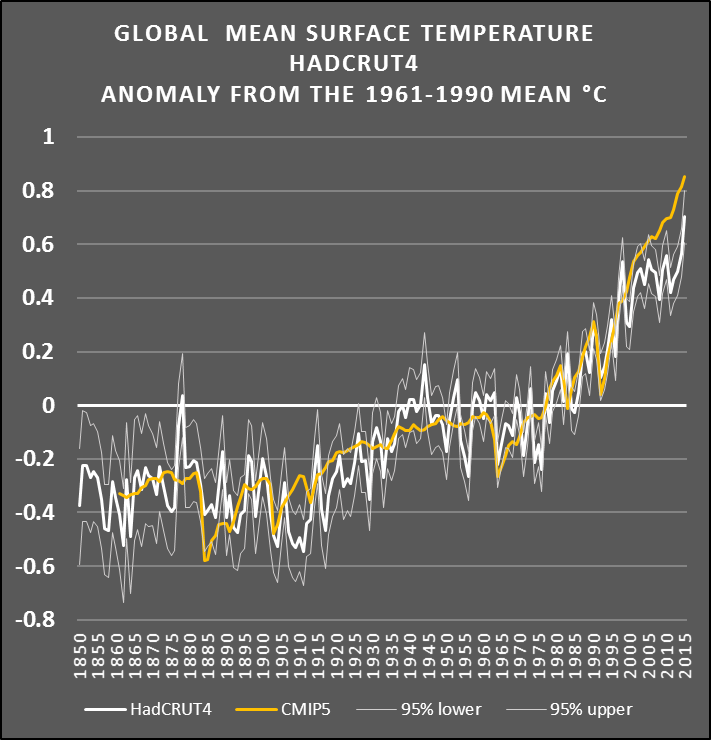
If you were able to read them correctly, you would see that both tables show the HadCRUT anomaly for 2015 is 0.71ºC.
Once more:
Here's how the data is formatted:
http://www.cru.uea.ac.uk/cru/data/temperature/for year = 1850 to endyear
format(i5,13f7.3) year, 12 * monthly values, annual value
Year, 12 entries of monthly values, annual value.
Your position is wrong.
Just read the legend.


