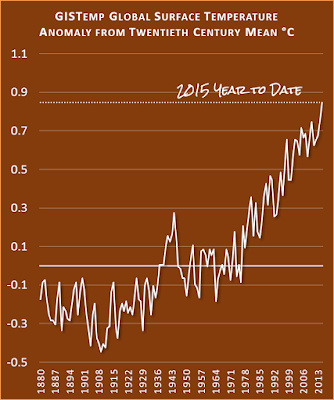
Wrong again, moviefan.To be fair to Basketcase, we should remember that Frankfooter also doesn't know how to read a graph.
In September, the HadCRUT4 data showed the temperature anomaly for 2015 to be 0.68°C. It has increased slightly since then to 0.71°C.
And yet, Franky reported the following....
Sept. 5, 2015 -- He said the HadCRUT4 temperature anomaly for 2015 was 0.809°C: https://terb.cc/vbulletin/showthrea...ng-Scientist&p=5339893&viewfull=1#post5339893
Nov. 29, 2015 -- He said the HadCRUT4 temperature anomaly for 2015 was 0.79°C: https://terb.cc/vbulletin/showthrea...imate-Change&p=5411834&viewfull=1#post5411834
Franky has no idea what he's talking about.
You're on a roll.
You are committing the very sin you accuse others of.
You are comparing posts that have the following differences:The point I have been making is Basketcase was mixing and matching numbers from different data sets (without any adjustments) to create a fairy-tale depiction of warming.
a) dates - March vs a post in November
b) different data sets - One references Hadcrut 4 and the other Hadcrut 4.4.0
First post links to:
http://www.metoffice.gov.uk/hadobs/...time_series/HadCRUT.4.4.0.0.annual_ns_avg.txt
Second post refers to this post:
https://terb.cc/vbulletin/showthrea...imate-Change&p=5411584&viewfull=1#post5411584
links to:
http://www.cru.uea.ac.uk/cru/data/temperature/HadCRUT4-gl.dat
According to your terms, you have no idea what you are talking about.


