October Smashes Temperature Records Practically Guaranteeing 2015 Will Be HottestYear

Moviefan-2

Court Jester
Oct 17, 2011
10,489
171
63
You chose the IPCC(ish) graph as a valid source. You chose the hadcrut data as a valid source. Now that it is 100% clear that the hadcrut data you posted fits withing the IPCC projections you posted all you have is avoidance and insults.
Speaking of avoidance, I see you're ignoring the fact that you were caught mixing and matching numbers from two entirely different data sets -- proving that you don't know how to read a graph.

In his own ass-backwards way, even Frankfooter nailed you on this one:

You can quite clearly use data from different sources if you adjust for the different baselines.
https://terb.cc/vbulletin/showthread.php?p=5413209#post5413209

Too bad you didn't "adjust for the different baselines." :biggrin1:

But I'm going to give you a chance to redeem yourself. I'll make this one easy for you.

Franky's graph shows the IPCC predicted a 0.85ºC anomaly for this year, and the actual HadCRUT4 anomaly is currently 0.71ºC.

Yes or no: Is the 0.71ºC anomaly well below the prediction of 0.85ºC?
 

basketcase

Well-known member
Dec 29, 2005
61,423
6,691
113
Speaking of avoidance, I see you're ignoring the fact that you were caught mixing and matching numbers from two entirely different data sets -- proving that you don't know how to read a graph.

But I'm going to give you a chance to redeem yourself. I'll make this one easy for you.

Franky's graph shows the IPCC predicted a 0.85ºC anomaly for this year, and the actual HadCRUT4 anomaly is currently 0.71ºC.

Yes or no: Is the 0.71ºC anomaly well below the prediction of 0.85ºC?
As I said, all you have left is trying to make other people look bad. You gave up on even the pretense of scientific argument.

Your own sources show that the hadcrut numbers match the IPCC projections.
 

Moviefan-2

Court Jester
Oct 17, 2011
10,489
171
63
As I said, all you have left is trying to make other people look bad.
What are you talking about? I gave you a chance to redeem yourself.

I've even made it easy for you. Let's try again:

Franky's graph shows the IPCC predicted a 0.85ºC anomaly for this year, and the actual HadCRUT4 anomaly is currently 0.71ºC.

Yes or no: Is the 0.71ºC anomaly well below the prediction of 0.85ºC?
 

basketcase

Well-known member
Dec 29, 2005
61,423
6,691
113
What are you talking about? I gave you a chance to redeem yourself.

I've even made it easy for you. Let's try again:

Franky's graph shows the IPCC predicted a 0.85ºC anomaly for this year, and the actual HadCRUT4 anomaly is currently 0.71ºC.

Yes or no: Is the 0.71ºC anomaly well below the prediction of 0.85ºC?
I'll give you a chance. Does the hadcrut data you keep posting fit in the projections you keep posting?

http://www.cru.uea.ac.uk/cru/data/temperature/
http://www.science-skeptical.de/wp-content/uploads/2012/12/Entwurf3-1024x876.jpg
 

Frankfooter

dangling member
Apr 10, 2015
91,516
22,161
113

Frankfooter

dangling member
Apr 10, 2015
91,516
22,161
113
Franky's graph shows the IPCC predicted a 0.85ºC anomaly for this year, and the actual HadCRUT4 anomaly is currently 0.71ºC.

Yes or no: Is the 0.71ºC anomaly well below the prediction of 0.85ºC?
You are screwing up and comparing different data sets again.
Met uses 1961-1990 as their baseline, if you want to use an IPCC projection that uses the same baseline, use this chart:
(and note that even 0.71ºC makes that chart spectacularly correct)


Moviefan-2

Court Jester
Oct 17, 2011
10,489
171
63
You are screwing up and comparing different data sets again.
Say what?

It was your graph that I quoted. And as you like to point out, it has been updated to 2015.

And for bonus, here's a chart of projections vs reality, which you still claim are 'spectacularly wrong'.
Your graph shows the IPCC prediction for 2015 at 0.85ºC and the anomaly for 2015 at 0.71ºC.

You posted that graph numerous times. Are you saying you don't believe it is accurate?
 

Moviefan-2

Court Jester
Oct 17, 2011
10,489
171
63
I'll give you a chance. Does the hadcrut data you keep posting fit in the projections you keep posting?

http://www.cru.uea.ac.uk/cru/data/temperature/
http://www.science-skeptical.de/wp-content/uploads/2012/12/Entwurf3-1024x876.jpg
You're still mixing and matching the wrong things.

Much as the data have been updated, so have the predictions. You have to compare the current anomalies with the CMIP5 run, not the CMIP3 run in your graph.

When we compare the current data with the current predictions, my answer is no, I don't think a 0.71ºC anomaly is a "fit" with a prediction of 0.85ºC. I say the IPCC's predictions have been spectacularly wrong.

Now, it's your turn.

Yes or no: Is the 0.71ºC anomaly well below the prediction of 0.85ºC?
 

Frankfooter

dangling member
Apr 10, 2015
91,516
22,161
113
Hilarious. So your position is that it's just a coincidence that the column in your first table is the exact same as the column in your second one.

Unbelievable.
And your position is that the published legend for the data is wrong and you are right?
That's unbelievable.
 

Frankfooter

dangling member
Apr 10, 2015
91,516
22,161
113
Your graph shows the IPCC prediction for 2015 at 0.85ºC and the anomaly for 2015 at 0.71ºC.

You posted that graph numerous times. Are you saying you don't believe it is accurate?
That's a chart from hotwhopper.com.
If you want to reference IPCC projections, you must use IPCC projections.
This is the chart you should refer to in reference to the IPCC, its the legit chart from them, not the one you lie about.

Otherwise you are mixing data sets and claims, just like you whine about.


And if you put the latest Met figures in that chart, you have to admit that the IPCC's projections were spot on.
 

basketcase

Well-known member
Dec 29, 2005
61,423
6,691
113
You're still ...
You're still making excuses. You claim that there has been no temperature increase this century yet even the data you post shows that is spectacularly wrong.

And when the data you posts matches the graphs you post, all you do is prove you are spectacularly wrong once again.
 

AK-47

Armed to the tits
Mar 6, 2009
6,697
1
0
In the 6
You guys are making me dizzy with all your graphs
 

Moviefan-2

Court Jester
Oct 17, 2011
10,489
171
63
And your position is that the published legend for the data is wrong and you are right?
That's unbelievable.
LMFAO.

No, my position is that the tables are correct. The problem is that you're not reading them correctly.

If you were able to read them correctly, you would see that both tables show the HadCRUT anomaly for 2015 is 0.71ºC.
 

Moviefan-2

Court Jester
Oct 17, 2011
10,489
171
63
That's a chart from hotwhopper.com.
If you want to reference IPCC projections, you must use IPCC projections.
This is the chart you should refer to in reference to the IPCC, its the legit chart from them, not the one you lie about.
In Chapter 9 of its AR5 report, the IPCC said the IPCC graph you're citing showed a 97% failure rate. The IPCC said three of the model runs (the ones that predicted stagnant temperatures) were correct and 111 of them were wrong.

Page 769: http://www.ipcc.ch/pdf/assessment-report/ar5/wg1/WG1AR5_Chapter09_FINAL.pdf

However, you and Basketcase spent weeks complaining that the IPCC graphs are "years" out of date: https://terb.cc/vbulletin/showthrea...ng-Scientist&p=5319812&viewfull=1#post5319812

Fine. I'm quite comfortable using your updated graph. It shows pretty much the same IPCC prediction (about 0.85ºC) as was in the National Post graph I posted a few months ago (https://financialpostbusiness.files.wordpress.com/2014/06/fe0617_climate_c_mf.jpeg?w=620&h=552).

In your own words: the hotwhopper.com graph is a "chart of projections vs reality."

https://terb.cc/vbulletin/showthread.php?p=5405140#post5405140

It makes no difference to me. All of the graphs confirm the IPCC's predictions have been spectacularly wrong.

But why are you now running away from your own graph? Are you saying your sources got it wrong?
 
Last edited:

Moviefan-2

Court Jester
Oct 17, 2011
10,489
171
63
And when the data you posts matches the graphs you post, all you do is prove you are spectacularly wrong once again.
Nonsense.

I provided a direct answer to your question. My answer is No, the 0.71ºC anomaly for 2015 is not a "fit" with the IPCC prediction of 0.85ºC.

Now, it's your turn.

Yes or no: Is the 0.71ºC anomaly well below the prediction of 0.85ºC?
 

Moviefan-2

Court Jester
Oct 17, 2011
10,489
171
63
Since it's Throwback Thursday, here's our daily laugh from last August:

Moviefan bases his argument around using only 1 year, 1998, a super El Nino year, in a technique called 'cherry picking'.
https://terb.cc/vbulletin/showthrea...ng-Scientist&p=5324219&viewfull=1#post5324219

Apparently, using a "super El Nino year" to make arguments about the Earth's temperature is "cherry picking."

Certainly, you would never see Franky or Basketcase trying to use 2015 to make some sort of point about warming. :thumb:
 

FAST

Banned
Mar 12, 2004
10,069
1
0
Since it's Throwback Thursday, here's our daily laugh from last August:


https://terb.cc/vbulletin/showthrea...ng-Scientist&p=5324219&viewfull=1#post5324219

Apparently, using a "super El Nino year" to make arguments about the Earth's temperature is "cherry picking."

Certainly, you would never see Franky or Basketcase trying to use 2015 to make some sort of point about warming. :thumb:
YA,...but that's different,... because the UNEMPLOYABLEs make up the rules as they go along,...and re-write history,... because NOBODY questions them.

And our resident Marxist,...goes along with this bull shit,...because he thinks this bull shit may bring down the free market/capitalism economies.

Not that he gives a shit about the climate.

FAST
 

AK-47

Armed to the tits
Mar 6, 2009
6,697
1
0
In the 6
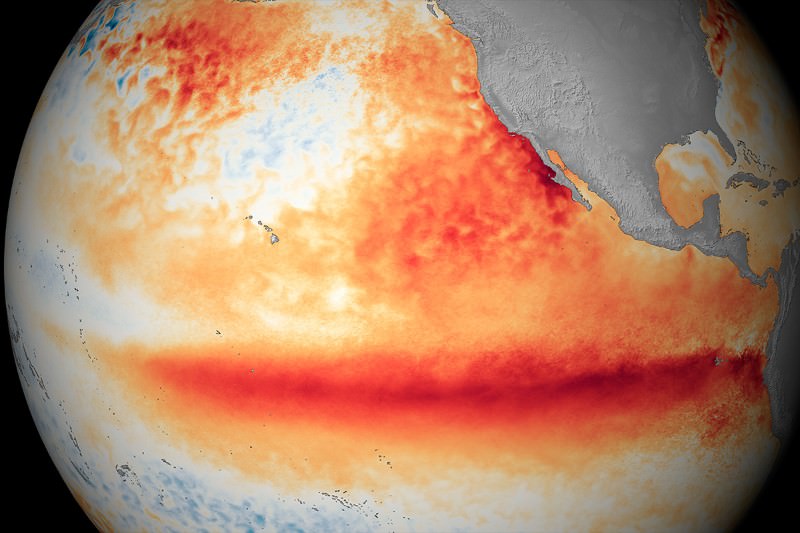
This years El Nino is now strongest on record. I'm loving every minute of it, break out the suntan lotion

https://www.newscientist.com/articl...eping-globe-is-now-the-biggest-ever-recorded/


The current extreme El Niño is now the strongest ever recorded, smashing the previous record from 1997-8. Already wreaking havoc on weather around the world, the new figures mean those effects will probably get worse. Climate change could be to blame and is known to be making the extreme impacts of El Niño on weather more likely.

The 1997-8 El Niño killed 20,000 people and caused almost $97 billion of damage as floods, droughts, fires, cyclones and mudslides ravaged the world.

Now the current El Niño has surpassed the 1997-8 El Niño on a key measure, according to the latest figures released by the US National Oceanic and Atmospheric Agency.

El Niño occurs when warm water that has piled up around Australia and Indonesia spills out east across the Pacific Ocean towards the Americas, taking the rain with it.

A key measure of its intensity is the warmth of water in the central Pacific. In 1997, at its peak on 26 November, it was 2.8 °C above average. According to the latest measurements, it reached 2.8 °C on 4 November this year, and went on to hit 3.1 °C on 18 November – the highest temperatures ever seen in this region
 
Ashley Madison
Toronto Escorts