★ Have you made up your mind on climate change, yet?

Moviefan-2

Court Jester
Oct 17, 2011
10,489
171
63
Fuck it, I'm not wasting all night watching the little coward evade the question.

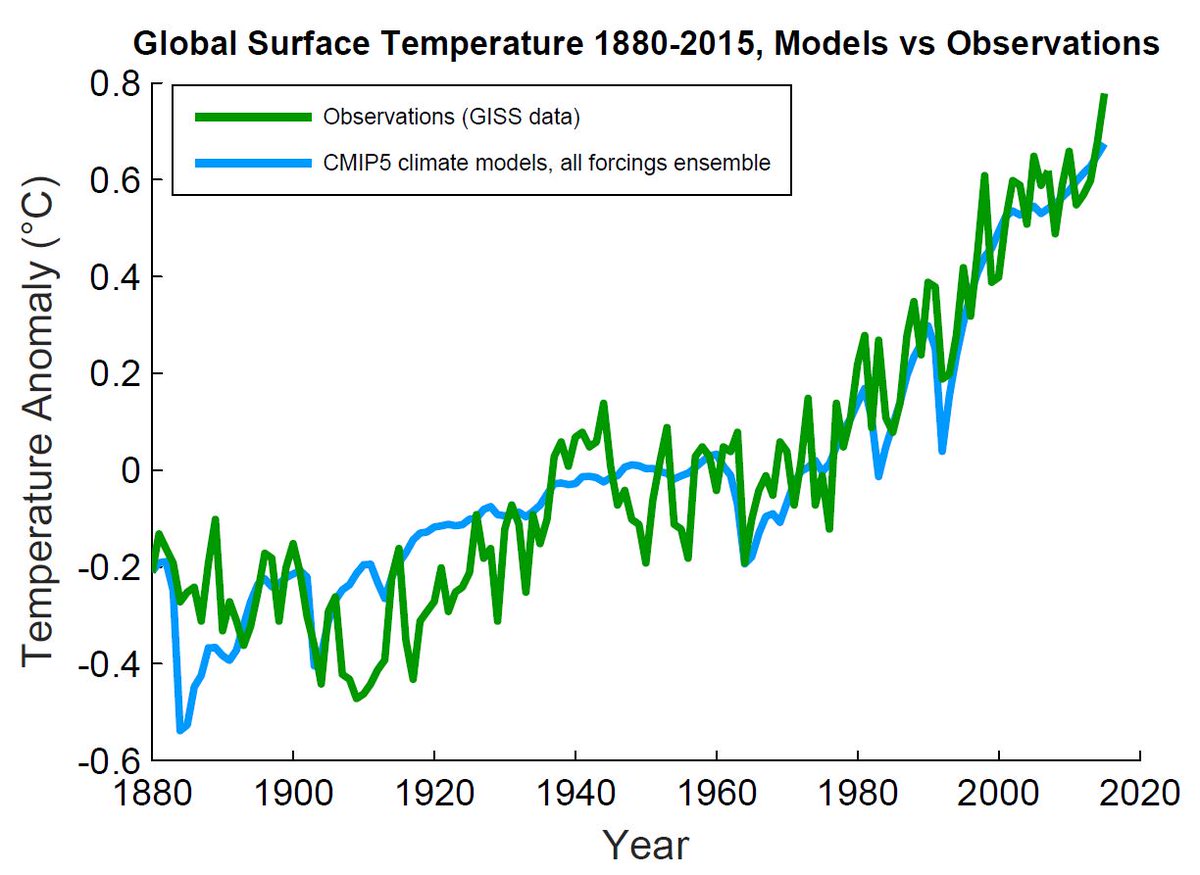
The correct answer is yes, as is seen in Gavin Schmidt's graph below. When you make the appropriate adjustments, the different bodies' thermometer readings of surface temperatures are all similar.
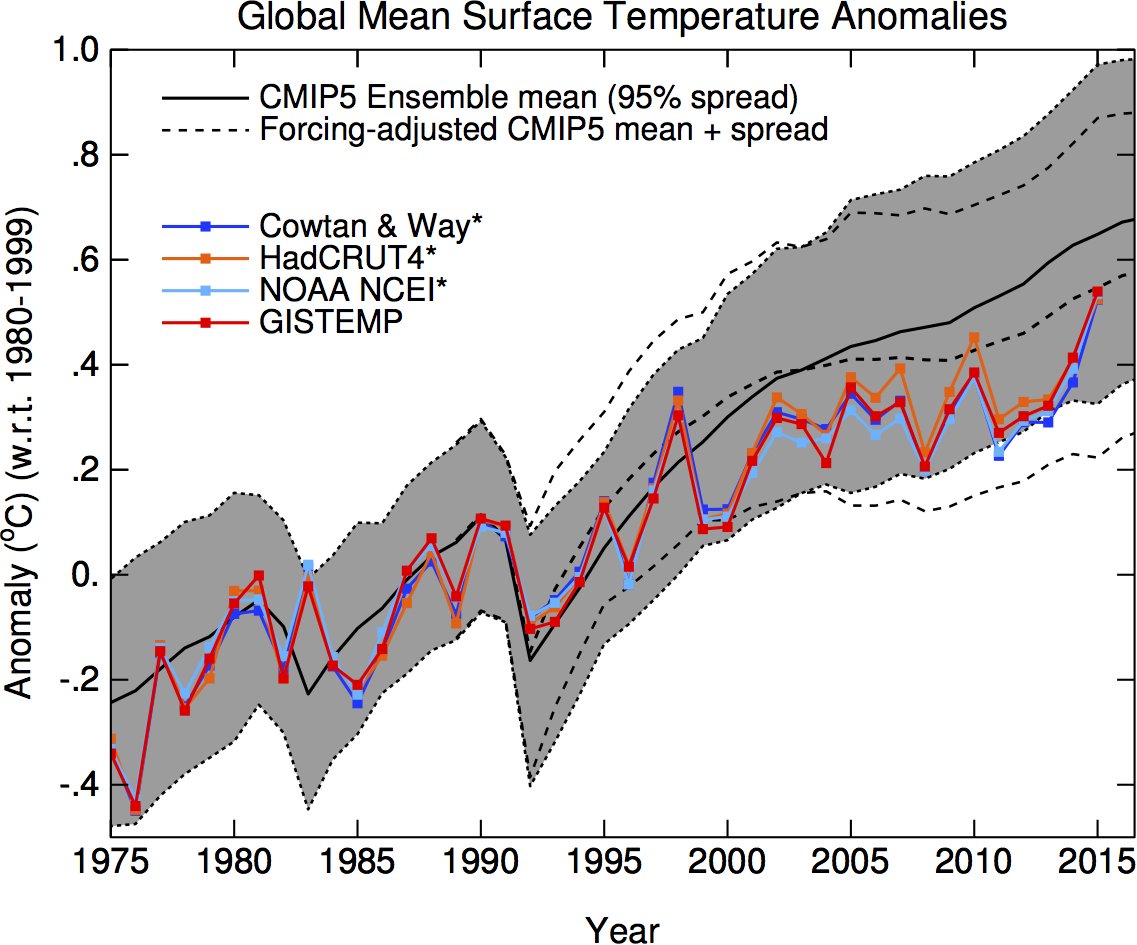


That means that when you use the Met Office's baseline, the reported temperature anomalies for 2015 are all comparable to the 0.745ºC reported by the Met Office.

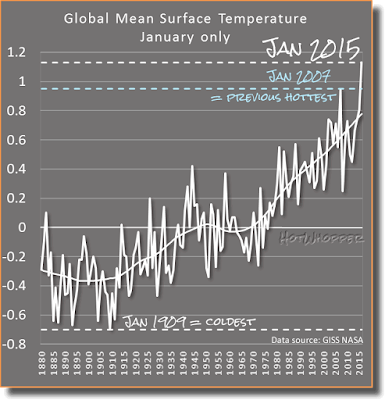
And 0.745ºC is nowhere near the IPCC "projection" of 0.85ºC for 2015 (which was derived from the same 1961-1990 baseline, as shown in the Hotwhopper graph).

http://1.bp.blogspot.com/-rRPfFl2DQ...an+surface+temperature+hadcrut4+and+model.png

Just as I said.

In fact, the Met Office reported that the HadCRUT4 data showed a final anomaly of 0.745ºC for 2015:

https://crudata.uea.ac.uk/cru/data/temperature/HadCRUT4.pdf

And 0.745ºC is well below 0.85ºC -- proving that Crybaby Frankfooter still doesn't know how to read a graph.
"Whoops," indeed. :thumb:
 

Frankfooter

dangling member
Apr 10, 2015
91,516
22,161
113
That means the reported temperature anomalies for 2015 are all comparable to the 0.745ºC reported by the Met Office.

And 0.745ºC is nowhere near the IPCC "projection" of 0.85ºC for 2015 -- just as I said.

"Whoops," indeed.
Yes, 'whoops'.

You made a whopper of a basic mistake, showing that you are really quite stupid, despite my warning you and asking you really easy and direct questions.
You compared the MET office findings with NASA as if they had the same baseline, or worked off the same dates as their zero.
But they don't, do they?

For instance, look at the chart on this site:
http://www.carbonbrief.org/explainer-how-surface-and-satellite-temperature-records-compare
Those all agree as well, but that uses a 1981-2010 baseline, so they all agree at 0.5ºC anomaly for 2015.

Or look at the chart on this page:
http://www.giss.nasa.gov/research/features/201501_gistemp/
That chart uses a different baseline (which isn't posted), all the surface temp readings are also similar but the come out to a different number, similar to the MET findings.

Or even take a look at the chart you posted, which states on its left hand side that its baseline is '1980-1999'.
Three different baselines.

Now, we've been using NASA's numbers, including their baseline, 1951-1980.
http://climate.nasa.gov/vital-signs/global-temperature/

The MET uses a different baseline, 1961-1990.
http://ukclimateprojections.metoffice.gov.uk/23204

So your big fucking 'whoops' is a big fucking whoops of colossal stupidity.
You claimed that that all recorded anomalies are therefore '0.745ºC'.
That means the reported temperature anomalies for 2015 are all comparable to the 0.745ºC reported by the Met Office.
That's a really stupid mistake.

And as you know, we used NASA's baselines for the bets and for the calculation of the IPCC projection for 2015 (which was 0.83ºC by the way, not 0.85ºC).
The important thing for me was to reaffirm that the bet was on NASA's numbers.
You posted a graph that showed a 0.43ºC anomaly for 1995 and we agreed to bet on whether there would be a minimum increase of 0.4ºC over 20 years.

So we bet on the remaining distance from the original 1995 anomaly of 0.43ºC.

Using your 1995 anomaly as the starting point and the bet of a 0.40ºC increase, tell us what number you get
You fucked up and are trying to use the MET baseline as if it were the same as NASA's baseline.
Wrong.

Its that kind of colossal stupidity that keeps you from admitting you lost the bet.
 

Moviefan-2

Court Jester
Oct 17, 2011
10,489
171
63

bishop

Banned
Nov 26, 2002
1,800
0
36
Proving that you have no idea what baseline is used before you made any accusations.
As usual, you don't know what you are talking about.


Just as you call these results 'spectacularly inaccurate'.
You can't tell legit science from bullshit.

Frank what in particular about that graph is impressive to you?
 

Frankfooter

dangling member
Apr 10, 2015
91,516
22,161
113
Frank what in particular about that graph is impressive to you?
That chart compares IPCC projections for climate change with reality, as measured by NASA, NOAA et al.
It shows that the IPCC's work is solid and well done.

The bet between moviefan and I was based on those same projections, which is why moviefan lost.
Their work is good, but as shown above in post #162, moviefan doesn't know what he is talking about.
 

bishop

Banned
Nov 26, 2002
1,800
0
36
That chart compares IPCC projections for climate change with reality, as measured by NASA, NOAA et al.
It shows that the IPCC's work is solid and well done.

The bet between moviefan and I was based on those same projections, which is why moviefan lost.
Their work is good, but as shown above in post #162, moviefan doesn't know what he is talking about.
These projections you are talking about that impresses you so much, are you saying the entire graph is impressive or is there a particular section of the projections that is impressive?
 

Frankfooter

dangling member
Apr 10, 2015
91,516
22,161
113
And 0.745ºC is nowhere near the IPCC "projection" of 0.85ºC for 2015 (which was derived from the same 1961-1990 baseline, as shown in the Hotwhopper graph).
"Whoops," indeed. :thumb:
https://terb.cc/vbulletin/showthrea...e-change-yet&p=5475131&viewfull=1#post5475131

You don't know what you are talking about.
Such a basic mistake to make, no wonder you lost the bet.

I hadn't considered this, but maybe you just aren't smart enough to understand that you lost a really simple bet.
Its a really simple bet, but maybe you just can't understand it.

This was the bet:
So in order to win the bet, all the temperature has to do is hit 0.83ºC anomaly for the year of 2015, correct?
http://climate.nasa.gov/vital-signs/global-temperature/

If that's the chart you're saying will hit 0.83 at the end of 2015, we definitely have a bet.
You bet on what NASA would post as the 2015 anomaly on the link above.
You even posted their finding of 0.87ºC for 2015 in this thread.

But maybe you aren't smart enough to tell us if 0.87ºC is higher then 0.83ºC.
Give it a try.

0.87ºC
http://climate.nasa.gov/vital-signs/global-temperature/t
You lost the bet.
Time to pay up.
 

Frankfooter

dangling member
Apr 10, 2015
91,516
22,161
113
These projections you are talking about that impresses you so much, are you saying the entire graph is impressive or is there a particular section of the projections that is impressive?
Are you not impressed that computer models of the whole world's climate can so accurately predict the increase in global temperature?

Would you be more impressed with the climate work of moviefan's favourite site, wattsupwithat, who predicted a small ice age to start about now?
https://archive.is/pDa7Q


It's the bastardization of science by people with political agendas that upsets me.
I don't have any faith in NASA's numbers.

Quite a different picture emerges when you actually look at the facts (which, of course, Franky never does).

http://wattsupwiththat.com/2015/12/...o-the-fbi-under-rico-and-wire-fraud-statutes/
Are you telling me you'd take the work moviefan supports, predicting an ice age over the projections from the IPCC above as the most accurate?

These are the temperature increases that should be worrying people.
(January was just reported as the warmest January ever, another record broken. Below is a chart of January temperatures)


bishop

Banned
Nov 26, 2002
1,800
0
36
Sorry for all the questions, I am trying to see the graph through your eyes. So you are saying as a whole, the entire graph is impressive?
 

Frankfooter

dangling member
Apr 10, 2015
91,516
22,161
113
Sorry for all the questions, I am trying to see the graph through your eyes. So you are saying as a whole, the entire graph is impressive?
Ok, here you go.

The chart models past climate as well as projects into the future. The modelling of the past isn't in of itself as impressive since we know those temperatures. Its still a lot of work to create a model that can act like the climate has in the past. Of course its the projections into the future that are the most impressive. Lets take a look at a chart that's a bit clearer, from an older projection from 2000 or so.


That chart has a clear vertical line marked in it showing what is historic (hindcast) and what is a projection (forecast). The last 15 years in that chart are the projections, and that's a spot where you can judge how well they hold up to reality as measured by NASA, NOAA et al. The projections are the grey area, with the black line as the median and reality is there as the coloured lines. According to that chart the climate has always been within the projection ranges and this years numbers are dead in the middle of where the IPCC projected them to be. I'm impressed, that's a shit load of excellent work and helps prove with evidence that their claims about anthropogenic climate change are realistic.

As a contrast, the claims of moviefan that all changes were are undergoing are 'natural' have been given about a 0.01% chance of being correct.
http://www.theguardian.com/environme...e-change-study

There is a belief -- widely held by thousands of scientists throughout the world -- that natural causes play a significant role in temperature changes. Indeed, the IPCC only claims that man-made factors were a primary cause of warming after 1950. Yet there was a warming trend in the early part of the 20th century that was as significant as the warming from the late 1970s to the late 1990s. If everyone is agreed that human activity wasn't the primary cause of warming in the early part of the last century, that pretty much leaves natural causes.

And, as we all should know, there was nothing unprecedented in the warming that occurred in any part of the 20th century.
That chart, when you compare it with the claims of moviefan's, for example, are really spectacularly accurate.
And if moviefan is a typically informed climate change denier, it lays it out as which is the credible source here.

The science is solid.
Moviefan not at all.
 

bishop

Banned
Nov 26, 2002
1,800
0
36
Frank can you not swap graphs on me, we were talking about CIMP5. I am trying to understand what about CIMP5 is impressive to you. Please go back and answer my questions.
 

Frankfooter

dangling member
Apr 10, 2015
91,516
22,161
113
Frank can you not swap graphs on me, we were talking about CIMP5. I am trying to understand what about CIMP5 is impressive to you. Please go back and answer my questions.
Its the same idea, but that chart makes it clearer for two reasons:
1) the hindcast vs forecast markings
2) being an older chart and older projection, the projection time is longer, there is more time to judge its accuracy on the chart

Otherwise I'd make the exact same arguments with the newer chart.

And I'd like to point out that I did answer your question clearly with examples.
Why do you not accept my answer?


bishop

Banned
Nov 26, 2002
1,800
0
36
CIMP5 was released at the end of 2013, at best it has 2 years worth of predictions, are you saying that the last 2 years on the graph is so compelling that one should just embrace a non science as a science?
 

Frankfooter

dangling member
Apr 10, 2015
91,516
22,161
113
CIMP5 was released at the end of 2013, at best it has 2 years worth of predictions, are you saying that the last 2 years on the graph is so compelling that one should just embrace a non science as a science?
That is exactly why I showed you the chart with CIMP3, an earlier model that has a longer period to judge its accuracy on.
Is the reason why you didn't want to accept it only because it proves your claim to be wrong?

And how can you call the IPCC's work 'non-science' when it is supported by the largest scientific organization in North America representing the largest body of scientists.
http://whatweknow.aaas.org/

Are you claiming you are a better judge of what is science then they are?
 

bishop

Banned
Nov 26, 2002
1,800
0
36
Frank can you tell the frank from post #148 that he is retarded for using CIMP5 as evidence that "the IPCC's projections really quite good"
 

Moviefan-2

Court Jester
Oct 17, 2011
10,489
171
63
Its a really simple bet...This was the bet:
The bet ... was based on continually updated chart posted by NASA at this address:
http://climate.nasa.gov/vital-signs/global-temperature/

It was a year-over-year increase of 0.15ºC of the 2014 anomaly from the time of the bet.
NASA said:
Globally-averaged temperatures in 2015 shattered the previous mark set in 2014 by 0.23 degrees Fahrenheit (0.13 Celsius).

https://www.nasa.gov/press-release/...d-shattering-global-warm-temperatures-in-2015


That's not NASA.
...now you're faking charts.
Yet another lie from you, claiming that's chart we bet on.
....still insisting on using non-legit source?
Now you're down to copying and pasting random ... quotes as if they had some kind of point to them.
LMFAO! :biggrin1:
 

Moviefan-2

Court Jester
Oct 17, 2011
10,489
171
63
Frank can you not swap graphs on me, we were talking about CIMP5.
His entire claim about the bet is based on switching graphs.

But in the case of the bet, it's worse than that -- he's been cherry-picking numbers from different graphs to support his fairy-tale claims.

He's been using the 2015 anomaly of 0.87ºC from NASA's new graph (which changed in July 2015 to a completely different methodology for measuring sea surface temperatures), while insisting that I be held to the old graph for the temperature anomalies from 1995 to 2014. That's how he came up with this magical equation:

Frankfooter says 0.74 + 0.15 = 0.83.

But maybe you aren't smart enough to tell us if 0.87ºC is higher then 0.83ºC.
Give it a try.

0.87ºC
http://climate.nasa.gov/vital-signs/global-temperature/t
For what it's worth, his claim in post #130 that the current temperature anomaly is in line with the IPCC's predictions was also based on mixing and matching completely different data sets.
 
Last edited:

Frankfooter

dangling member
Apr 10, 2015
91,516
22,161
113
His entire claim about the bet is based on switching graphs.
You are lying again.
The bet was based on the constantly updated chart you picked for the bet.
So in order to win the bet, all the temperature has to do is hit 0.83ºC anomaly for the year of 2015, correct?
http://climate.nasa.gov/vital-signs/global-temperature/

If that's the chart you're saying will hit 0.83 at the end of 2015, we definitely have a bet.
That's the only chart, its live, still at the same address in the bet and still being updated.


You, however are now up to 4 different numbers, 4 attempts to move the goal posts.
4 different weasel 'denier' numbers.

Now, its really incredibly easy to find out what the global anomaly for 2015 was, according to NASA.
All you need to do is read the number NASA posted on the page we bet on, its there in bold print, 0.87ºC.
Moviefan tries 4 times, and each time he does his 'denier' math magic and each time he comes up with a different number.

The Four attempts at 'Moving the Goal Posts' of Moviefan:

#1 - 0.86ºC
The adjusted bet is 0.86 degrees Celsius. Take it or leave it.

You have until the end of Sunday to decide whether or not you are taking the adjusted bet.
#2 - 0.766ºC
That works out to an average for the year of 0.766ºC -- well below 0.83ºC. According to the exact terms that Frankfooter insisted must "stand," Frankfooter lost the bet.
https://terb.cc/vbulletin/showthrea...made-up-your-mind-on-climate-change-yet/page8

#3 - 0.89ºC
The 0.74ºC anomaly for 2014 plus the originally agreed-upon year-over-year increase of 0.15ºC equals 0.89ºC.

If you want to propose a revised bet of 0.89ºC, you might get an agreement.
#4 - 0.745ºC and 0.85ºC in the same bad post
And 0.745ºC is nowhere near the IPCC "projection" of 0.85ºC for 2015 (which was derived from the same 1961-1990 baseline, as shown in the Hotwhopper graph).


Moviefan just can't keep his numbers straight, he tried to move the goal posts so often its pathetic.
-- We bet that the temperature anomaly would increase in 2015 to 0.83ºC
 
Ashley Madison
Toronto Escorts