Is that a bit like a tobacco exec telling someone they can live with only one lung after cancer?Looks to me global warming in LA can be adapted to.
----------------------------------------------------------------------------------------------------------
Micrometeorological Simulations to Predict the
Impacts of Heat Mitigation Strategies on Pedestrian
Thermal Comfort in a Los Angeles Neighborhood
Global warming hits Los Angeles
- Thread starter Phil C. McNasty
- Start date
I'm sure that looking at yearly data of ice thickness and days open for skating won't show any trends right?Rideau canal not freezing up is not happening on a regular basis.
Its only happened once in the last 80 years
CANAL OPENING LATER ON AVERAGE SINCE 1996
There have been 25 skating seasons where the Rideau Canal Skateway opened in December, but a pre-New Year opening date has become increasingly rare.
The skating season has opened before Jan. 1 only six times since the 1995-96 season, compared to 19 times before that. The skateway opened in December 11 years in a row between 1971 and 1983 and had a six-year December opening streak from 1988 to 1993.
In the canal's first 26 seasons, the median opening date was Dec. 27. In the 26 years since the 1995-96 season, the median opening date has been Jan. 10. Across all 52 skating seasons, the median opening date is Jan. 1.

The Rideau Canal Skateway by the numbers
The Rideau Canal Skateway remains closed to skaters after a mild January and it is unclear if it will open before or after its record latest opening date of Feb. 2.
Your next excuse?
p.s. In case you don't have any other local stories to pretend you know about,


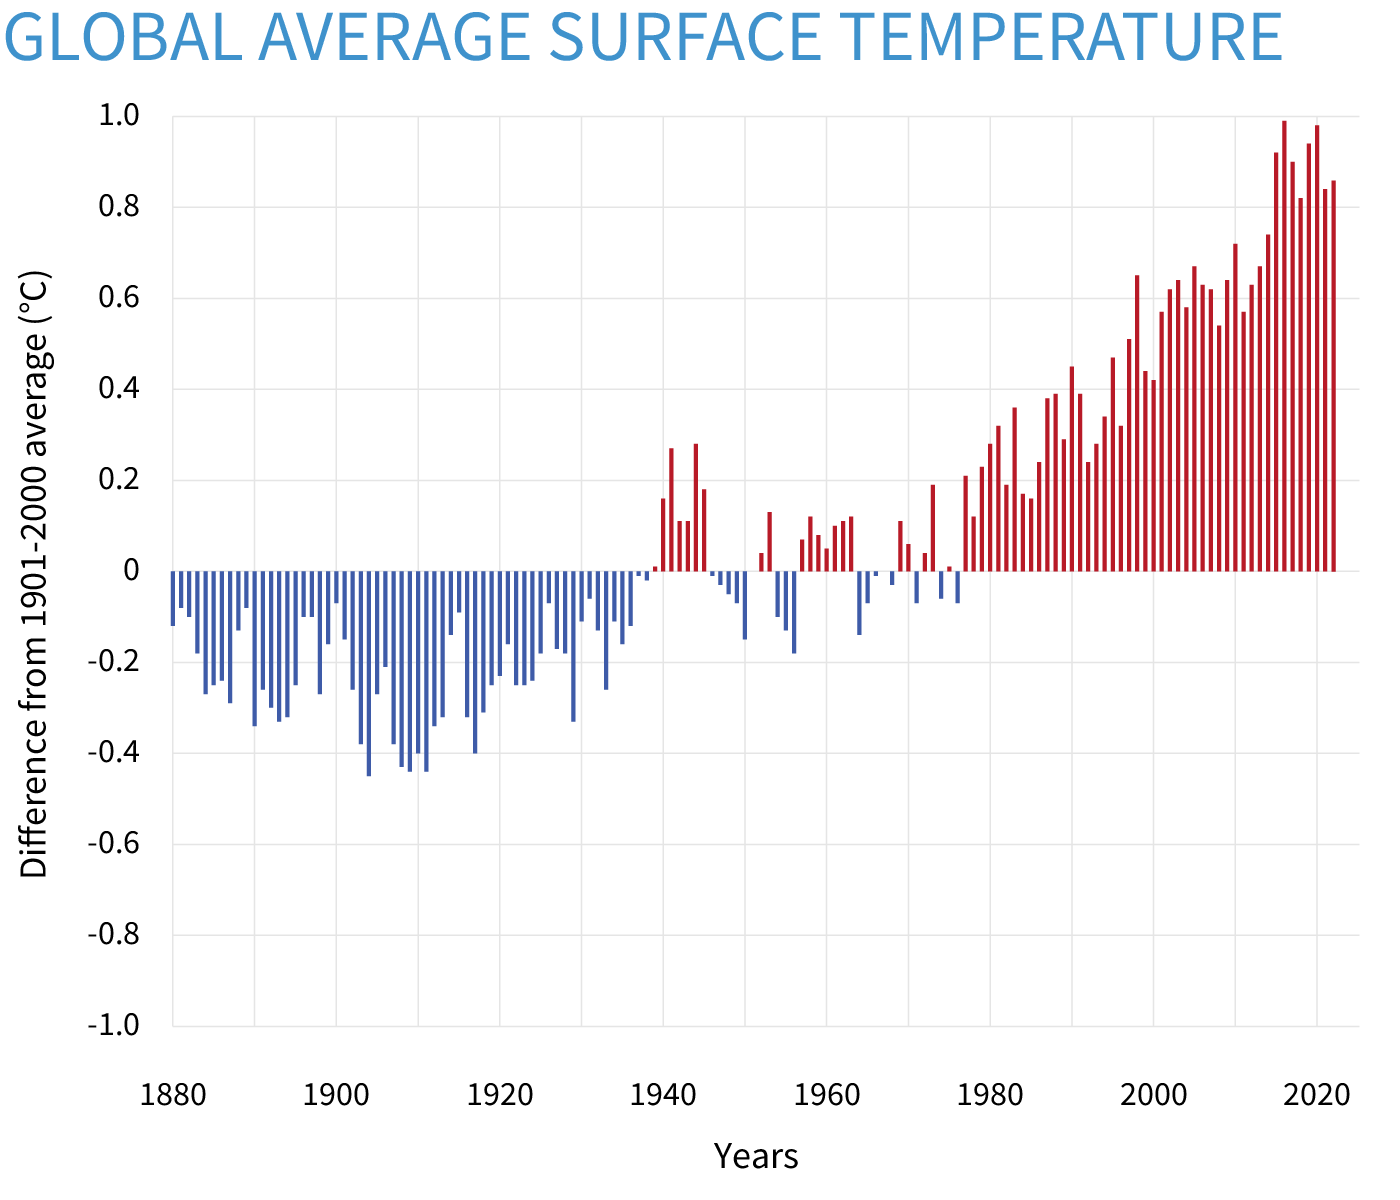
Climate change: global temperature
Earth's surface temperature has risen about 2 degrees Fahrenheit since the start of the NOAA record in 1850. It may seem like a small change, but it's a tremendous increase in stored heat.
Too small of a sample size since earth is 4.5 billion years oldI'm sure that looking at yearly data of ice thickness and days open for skating won't show any trends right?
CANAL OPENING LATER ON AVERAGE SINCE 1996
There have been 25 skating seasons where the Rideau Canal Skateway opened in December, but a pre-New Year opening date has become increasingly rare.
The skating season has opened before Jan. 1 only six times since the 1995-96 season, compared to 19 times before that. The skateway opened in December 11 years in a row between 1971 and 1983 and had a six-year December opening streak from 1988 to 1993.
In the canal's first 26 seasons, the median opening date was Dec. 27. In the 26 years since the 1995-96 season, the median opening date has been Jan. 10. Across all 52 skating seasons, the median opening date is Jan. 1.

The Rideau Canal Skateway by the numbers
The Rideau Canal Skateway remains closed to skaters after a mild January and it is unclear if it will open before or after its record latest opening date of Feb. 2.ottawa.ctvnews.ca
Your next excuse?
p.s. In case you don't have any other local stories to pretend you know about,
View attachment 214897

Climate change: global temperature
Earth's surface temperature has risen about 2 degrees Fahrenheit since the start of the NOAA record in 1850. It may seem like a small change, but it's a tremendous increase in stored heat.www.climate.gov
Last edited:
If Vostok Station is the 1st weather station founded in Antarctica then
there was probably no detailed climate/weather data collected for South
Pole and its vicinity prior to 1957.
No research stations of any type in Antarctica existed before 1898.
It seems safe to assume temperature in South Pole is missing in global
temperature up to the end of the 19th century. At any rate measurement
of an arbitrarily defined quantity which global temperature is has to be
viewed with skepticism.
Last edited:
How does Phil can write so many ridicule post per day? He wakes up earlyToo small of a sample size since earth is 4.5 billion years old
Which is why you only use stories from your grandfather as 'evidence'?Too small of a sample size since earth is 4.5 billion years old
Debate over global warming will not convince individuals
who win or lose their argument to seriously undertake reduction
of their carbon footprint. It is a pity what the climate movement
is going to accomplish is to exacerbate depletion of Earth's remaining
energy and mineral resources with no regard of the well being of future
generations.
who win or lose their argument to seriously undertake reduction
of their carbon footprint. It is a pity what the climate movement
is going to accomplish is to exacerbate depletion of Earth's remaining
energy and mineral resources with no regard of the well being of future
generations.
But you started this thread because of a single snowfall is evidence that climate change/global warming is debunked.Too small of a sample size since earth is 4.5 billion years old
How transparently hypocritical can you possibly be?
He is not a hypocrite, he is a conservative.But you started this thread because of a single snowfall is evidence that climate change/global warming is debunked.
How transparently hypocritical can you possibly be?
Too stupid an argument.Too small of a sample size since earth is 4.5 billion years old
It's like saying a tumour is too small a sample size of a human body to care about.
Thankfully scientists have all sorts of ways of gathering temperature and climate data that don't require a dude sitting there with a thermometer. Oxygen isotope ratios in ice cores is pretty hard to argue with.If Vostok Station is the 1st weather station founded in Antarctica then
there was probably no detailed climate/weather data collected for South
Pole and its vicinity prior to 1957.
No research stations of any type in Antarctica existed before 1898.
It seems safe to assume temperature in South Pole is missing in global
temperature up to the end of the 19th century. At any rate measurement
of an arbitrarily defined quantity which global temperature is has to be
viewed with skepticism.
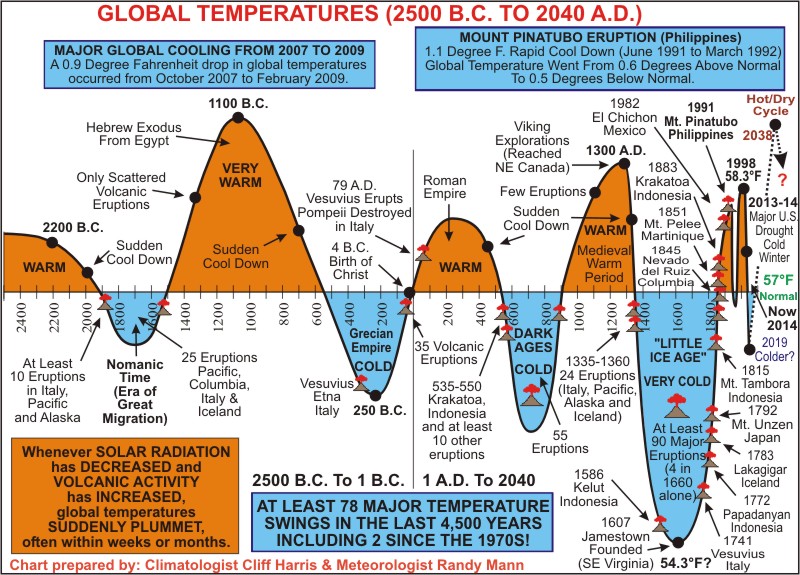
Its actually a very valid argument. See chartToo stupid an argument

How clueless do you have to be to post a chart that has no X scale or legend?Its actually a very valid argument. See chart

Pretty hard to argue with if error of uncertainty is comparable to that ofThankfully scientists have all sorts of ways of gathering temperature and climate data that don't require a dude sitting there with a thermometer. Oxygen isotope ratios in ice cores is pretty hard to argue with.
the reading of temperature taken from a thermometer which I think is
0.05 deg C. If you are talking about keeping global temp rise to within
1.5 deg C you have to be sure extrapolated temp from the past has an
uncertainty smaller than that.
Note that the variation of correlation coefficient referred to in the
study below is for temperature and isotope ratio data obtained from
a time when reliable weather data was available from weather stations.
The coefficient has to be close to unity for the estimation of past
temperature by extrapolation to be quantitatively reliable.
--------------------------------------------------------------------------------------------------------------
Goursaud, S., Masson-Delmotte, V., Favier, V., Orsi, A., and Werner, M.: Water stable isotope spatio-temporal variability in Antarctica in 1960–2013: observations and simulations from the ECHAM5-wiso atmospheric general circulation model, Clim. Past, 14, 923–946, https://doi.org/10.5194/cp-14-923-2018, 2018.
Water stable isotope spatio-temporal variability in Antarctica in 1960–2013: observations and simulations from the ECHAM5-wiso atmospheric general circulation model
Abstract
Polar ice core water isotope records are commonly used to infer past changes in Antarctic temperature, motivating an improved understanding and quantification of the temporal relationship between δ18O and temperature. This can be achieved using simulations performed by atmospheric general circulation models equipped with water stable isotopes. Here, we evaluate the skills of the high-resolution water-isotope-enabled atmospheric general circulation model ECHAM5-wiso (the European Centre Hamburg Model) nudged to European Centre for Medium-Range Weather Forecasts (ECMWF) reanalysis using simulations covering the period 1960–2013 over the Antarctic continent.
We compare model outputs with field data, first with a focus on regional climate variables and second on water stable isotopes, using our updated dataset of water stable isotope measurements from precipitation, snow, and firn–ice core samples. ECHAM5-wiso simulates a large increase in temperature from 1978 to 1979, possibly caused by a discontinuity in the European Reanalyses (ERA) linked to the assimilation of remote sensing data starting in 1979.
Although some model–data mismatches are observed, the (precipitation minus evaporation) outputs are found to be realistic products for surface mass balance. A warm model bias over central East Antarctica and a cold model bias over coastal regions explain first-order δ18O model biases by too-strong isotopic depletion on coastal areas and underestimated depletion inland. At the second order, despite these biases, ECHAM5-wiso correctly captures the observed spatial patterns of deuterium excess. The results of model–data comparisons for the inter-annual δ18O standard deviation differ when using precipitation or ice core data. Further studies should explore the importance of deposition and post-deposition processes affecting ice core signals and not resolved in the model.
These results build trust in the use of ECHAM5-wiso outputs to investigate the spatial, seasonal, and inter-annual δ18O–temperature relationships. We thus make the first Antarctica-wide synthesis of prior results. First, we show that local spatial or seasonal slopes are not a correct surrogate for inter-annual temporal slopes, leading to the conclusion that the same isotope–temperature slope cannot be applied for the climatic interpretation of Antarctic ice core for all timescales. Finally, we explore the phasing between the seasonal cycles of deuterium excess and δ18O as a source of information on changes in moisture sources affecting the δ18O–temperature relationship. The few available records and ECHAM5-wiso show different phase relationships in coastal, intermediate, and central regions.
This work evaluates the use of the ECHAM5-wiso model as a tool for the investigation of water stable isotopes in Antarctic precipitation and calls for extended studies to improve our understanding of such proxies.
Introduction
The Antarctic climate has been monitored from sparse weather stations providing instrumental records starting at best in 1957 (Nicolas and Bromwich, 2014). Water stable isotopes in Antarctic ice cores are key to expanding the documentation of spatio-temporal changes in polar climate and the hydrologic cycle (Jouzel et al., 1997) for the recent past (PAGES 2k Consortium, 2013; Stenni et al., 2017) as well as for glacial–interglacial variations (Jouzel et al., 2007; Schoenemann et al., 2014). Water stable isotopes measured along ice cores were initially used to infer Antarctic past temperatures using the spatial isotope–temperature slope (Lorius et al., 1969). The focus on inter-annual variations is motivated by the goal of quantifying temperature changes at the Earth's surface, including Antarctica, during the last millennia, to place current changes in the perspective of recent natural climate variability (Jones et al., 2016), to understand the drivers of this variability, and to test the ability of climate models to correctly represent it. This timescale is relevant for the response of the Antarctic climate to e.g. volcanic forcing and for the Antarctic climate fingerprint of large-scale modes of variability such as ENSO and the Southern Annular Mode (Smith and Stearns, 1993; Turner, 2004; Stammerjohn et al., 2008; Schroeter et al., 2017). The various climate signals potentially recorded in precipitation isotopic composition are, however, difficult to disentangle.
....................................................................................................
.......................................................................................................
We compare time series of instrumental temperature records (filled circles and dashed lines, Fig. 2) with model outputs (solid lines, Fig. 2) from 1960 to 2013. This comparison first highlights local offsets between observed and simulated mean values at each site, without a systematic overall warm or cold bias. Table 1 reports the statistical analysis of annual differences between observations and simulations (observed mean, mean difference between the data and the model outputs, observed versus simulated standard deviation). ECHAM5-wiso has a cold bias for 7 out of 10 stations. While this bias is less than 2 ∘C for Dronning Maud Land (Mawson and Neumayer) and over the peninsula (Palmer and Esperanza), it reaches 7 ∘C for the coastal Indian region(Casey and Dumont d'Urville) and is very strong over the Victoria Land region (McMurdo), reaching 15 ∘C. This cold bias may be due to the model resolution and the location of coastal stations in the ice-free region, where the small-scale topographic features are not accounted for at the model resolution. In contrast, ECHAM5-wiso has a warm bias for all the stations located inland (Vostok, Dome C, and Byrd). Werner et al. (2011) also reported this warm bias for the central Antarctic Plateau and suggested that it could be linked to problems in correctly simulating the polar atmospheric boundary layer. Our comparison also shows that the simulated inter-annual temperature variability is larger than observed for seven out of nine sites and is particularly overestimated for locations such as DDU, McMurdo, and Palmer, where the cold bias is large.
Figure 2 depicts a sharp simulated increase in temperature from 1978 to 1979 for all stations, except for the peninsula region (Esperanza and Palmer). Such a feature is not displayed in instrumental records, with one exception at McMurdo (Fig. 2). As a result, the model–data correlation coefficient for McMurdo is higher over 1960–2013 than over 1979–2013 (Table 2), possibly because it is dominated by the sharp increase just prior to 1979. For all other stations, the correlation coefficient is significantly higher in 1979–2013 than in 1960–2013. In order to assess whether ECHAM5-wiso reproduces the temperature bias displayed by ERA-40 (Bromwich et al., 2007), we compare outputs from ERA-40 and ERA-Interim (green bars, Fig. 3) with ECHAM5-wiso outputs (purple bars, Fig. 3) nudged by these reanalyses (i.e. over 1960–1978 and 1979–2013, respectively) and with the station temperature data (horizontal black lines, Fig. 3).
................................................................................................................
For this period marked by small temperature variations, we note that the correlation coefficient between data and model outputs (Table 2) is very small for McMurdo (r = 0.2) and rather small for Vostok (r = 0.6), questioning the ability of our simulation to resolve the drivers of inter-annual temperature variability at these locations. We observe that the model reproduces the amplitude of inter-annual variations, with a tendency to underestimate the variations as shown by model–data slopes from 0.6 to 1 ∘C per ∘C. As a result, ECHAM5-wiso underestimates the magnitude of inter-annual temperature variability for these central regions of the West and East Antarctic Ice Sheet. It will therefore be important to test whether similar caveats arise for water isotopes.
..................................................................................................
To conclude, the coherent framework provided by the ECHAM5-wiso simulation covering the period 1979–2013 shows that annual δ18O and surface temperatures are only weakly linearly related in several areas. This suggests that the inter-annual variability of δ18O is controlled by other processes, for instance those associated with synoptic variability and changes in moisture source characteristics (Sturm et al., 2010; Steiger et al., 2017). Moreover, our results rule out the application of a single isotope–temperature slope for all Antarctic ice core records on the inter-annual timescale, and the seasonal isotope–temperature slope is not a surrogate for scaling inter-annual δ18O to temperature.
.................................................................
Last edited:
Do you not see how stupid it is when you guys claim that historic climate data is so inaccurate that it proves climate change is a hoax then try to use historic data to prove a point (not to mention that your 'data' is laughably ridiculous - such as the claim that we're currently in a cold phase)?Its actually a very valid argument. See chart
...
I'd agree that man-made climate change based on output of computer
simulation is not a hoax. Climate emergency I am not so sure.
simulation is not a hoax. Climate emergency I am not so sure.
They actually think the Poles are going to meltI'd agree that man-made climate change based on output of computer
simulation is not a hoax. Climate emergency I am not so sure
I know that they're spelled differently, but what else?He is not a hypocrite, he is a conservative.


