Toronto Escorts

CBC report - Most Canadians don't think humans are the main cause of climate change

Moviefan-2

Court Jester
Oct 17, 2011
10,489
171
63
Sure. Right after you show us where the temperature stopped rising.


Your thesis is that there has been no 'statistical' temperature increase this century. Why do you refuse to defend your claims? More importantly why do you keep using sources that contradict your thesis?


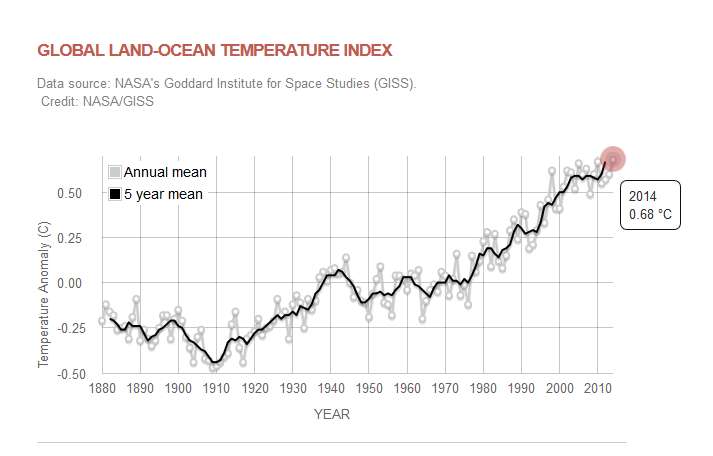
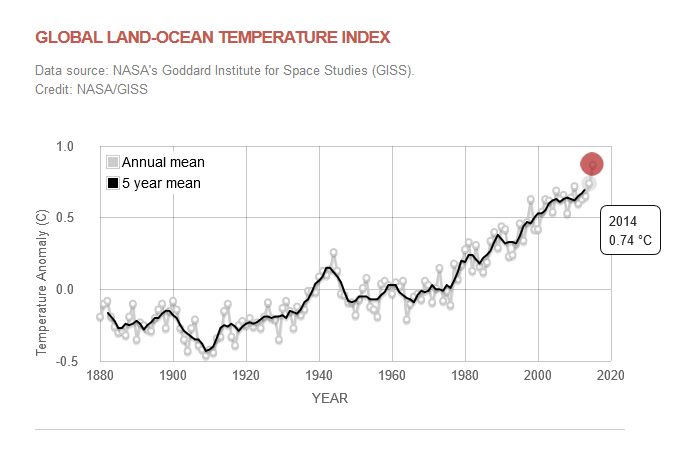
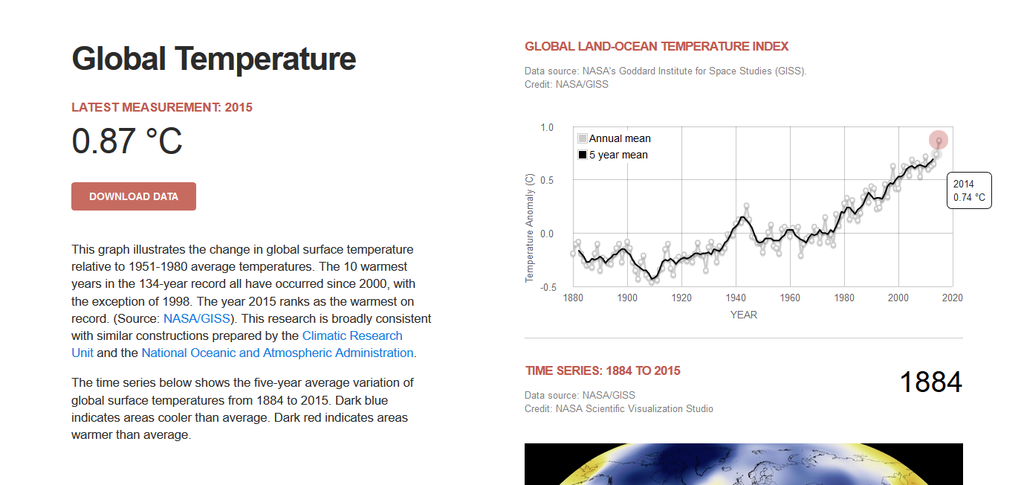
p.s. As usual you have chosen a graph that excludes the past year or two. Try plotting the observed data of 0.87 or 0.74 against that predicted curve. Just another case of you arguing against yourself.
You know, there's a part of me that feels sorry for you. But I hope you'll see the release of the Fyfe paper as a learning moment.

For the last few years, you have wrapped yourself in the "science" flag and insisted that anyone who disagreed with you was "anti-science" and/or a "conspiracy theorist."

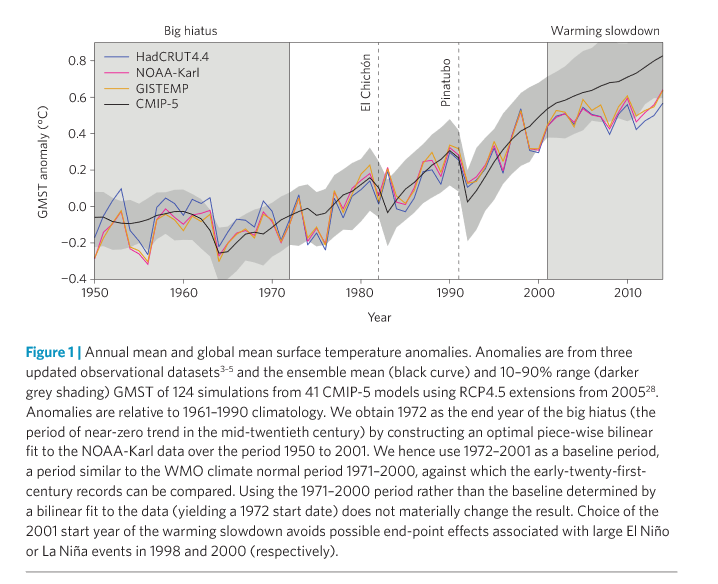
Now, a paper comes out that confirms the hiatus (as the paper says it is sometimes referred to in the literature) is supported by the evidence. And the paper was written by some of your favourite climate researchers.

http://www.nature.com/articles/ncli...trZLMnaUyec=&tracking_referrer=www.nature.com

I guess it's a little tough for you to conclude that the authors are "anti-science."

It's time to take a more mature view of these things. There is much that is unknown about the climate and people have every right to hold different views. The disagreements are legitimate. People who disagree with you aren't "anti-science", any more than you are "anti-science" for disagreeing with others.

Maybe it's wishful thinking, but I hope you learn from this.
 

Frankfooter

dangling member
Apr 10, 2015
84,603
19,285
113
You know, there's a part of me that feels sorry for you.
Is it the part of you that keeps posting the chart from NASA that shows you to be wrong?
On the one hand you keep posting NASA numbers, which as you have stated are in agreement with the Met Office, NOAA and other readings.
Time for you to answer a question:
Why are NASA's numbers for the global temperature so different from this one paper you are quoting?
How come you keep defending both of them?


Frankfooter

dangling member
Apr 10, 2015
84,603
19,285
113
????? :biggrin1:
This is from the first post you quoted:
So, now, 0.89 is an "imaginary" number.

Let's go through this again. We bet on a temperature anomaly (0.83 in the old data set)
that produces the exact same number by adding 0.4 to the 1995 anomaly or 0.15 to the 2014 anomaly (both years were described in the original terms).

Frankfooter's description of the bet:

-- Using 1995 as the starting year: 0.86
-- Using 2014 as the starting year: 0.89

My description of the bet:

-- Using 1995 as the starting year: 0.89
-- Using 2014 as the starting year: 0.89

Remember: To align with the original bet, the two numbers have to be the exact same.
Its a great reference for your faulty math, and for one of your attempts at cheating and weaselling out of the bet.

First, you admit we bet on 0.83ºC.
Then you change that number and falsely claim that I said it was "0.86ºC", after you agreed to continue the bet with its original numbers.
Then you claim that the bet was based on 2014's numbers + difference posted, instead of the 0.83ºC you already admitted the bet was made on.
All claims that 2014 were the starting date are total nonsense.
Next you add 0.15 to 0.83 and get 0.89, very bad math.
And finally you add the 0.40 to the 0.83 we bet on and also get 0.89.

Its just out of control!


You claimed that NASA used a different data set, except we didn't bet on a data set, we bet on the number NASA would post on this site:
http://climate.nasa.gov/vital-signs/global-temperature/

http://climate.nasa.gov/vital-signs/global-temperature/

If that's the chart you're saying will hit 0.83 at the end of 2015, we definitely have a bet.
That link, the one you picked in the bet, is still live.
NASA's findings on that page are what we bet on, and those numbers show you lost.

NASA reported:
- 2015 anomaly: 0.87ºC
Time to answer the question:
Is 0.87 higher then 0.83?
Come on moviefan, you love math challenges, can you do this one?
 

Moviefan-2

Court Jester
Oct 17, 2011
10,489
171
63
It was a year-over-year increase of 0.15ºC of the 2014 anomaly from the time of the bet.
Frankfooter says 0.74 + 0.15 = 0.83.
I have never said any such thing, its yet another weasel move, an out and out direct lie.
The bet was whether it would hit 0.83ºC.
LMFAO! :biggrin1:

No math is needed, you can keep your broken abacus out of this.
 

Moviefan-2

Court Jester
Oct 17, 2011
10,489
171
63
Why are NASA's numbers for the global temperature so different from this one paper you are quoting?
How come you keep defending both of them?
"Defending both of them?"

I compared the sea-surface temperature adjustments made last year by the NOAA and NASA to Enron-style accounting.

Sorry, Groggy, but Enron-style accounting doesn't qualify as an actual temperature increase.
I'll tell you what, you are now accusing NASA of 'Enron-style accounting'.
Where did you get the nutty idea that my comparison was defending their adjustments?
 
Last edited:

Frankfooter

dangling member
Apr 10, 2015
84,603
19,285
113
What's the question again?
Welcome to the endless climate change bet thread.
Moviefan and I made a bet whether or not the 2015 global temperature anomaly would hit 0.83º.
It went up to 0.87ºC and moviefan went all weasel like and refuses to admit he lost.
So far he's up to 7 different ways he's tried to deny he lost.

Enjoy the comedy.
 

Frankfooter

dangling member
Apr 10, 2015
84,603
19,285
113
???? :biggrin1:
Here you go, your post as if it were a grade 4 math test.
Enjoy.


Take a look below, where you use the real numbers and terms from the bet.
Compare those numbers to the numbers above.
You failed that math test.

We bet that the temperature anomaly would increase in 2015 to 0.83ºC
You posted a graph that showed a 0.43ºC anomaly for 1995 and we agreed to bet on whether there would be a minimum increase of 0.4ºC over 20 years.

So we bet on the remaining distance from the original 1995 anomaly of 0.43ºC.

NASA reported:
- 2015 anomaly: 0.87ºC
 
Last edited:

basketcase

Well-known member
Dec 29, 2005
60,354
6,468
113
They do?
....
Considering you keep posting that the anomalies are 0.74 and 0.87 they sure do.


And why do the graphs you post contradict your thesis of no warming? It's like the survey you posted where only 9% of scientists supported your views.
 

Moviefan-2

Court Jester
Oct 17, 2011
10,489
171
63
What's the question again?
I'm not sure if you're referring to the bet or the question in the CBC survey.

In terms of the bet, Frankfooter posted a NASA graph in May 2015 that showed a temperature anomaly for 1995 of 0.43ºC and what was supposedly an all-time high of 0.68ºC in 2014. He bet me whether or not the temperature anomaly would increase by at least a further 0.15ºC to a minimum of 0.83ºC in 2015.

It was a year-over-year increase of 0.15ºC of the 2014 anomaly from the time of the bet.
In July 2015, NASA announced it was using some controversial sea-surface temperature adjustments calculated by NOAA and completely rewrote the graph. Many of us would argue there was a lot of monkey business involved.

http://data.giss.nasa.gov/gistemp/updates_v3/ersst4vs3b/

Regardless, in terms of the bet, NASA's director responsible for the climate studies confirmed that the current years had all been adjusted at the same rate. That means the 0.15ºC increase that we bet on could be cleanly applied to the new graph.

Once the year had ended and it was confirmed that Frankfooter lost the bet, his insanity really kicked in.

He has made all kinds of preposterous claims, including allegations that the graphs on NASA's websites are fakes (https://terb.cc/vbulletin/showthrea...e-change-yet&p=5470561&viewfull=1#post5470561) or "possibly doctored."

He said I was "lying" about the difference between 0.68 and 0.83 being 0.15 (https://terb.cc/vbulletin/showthrea...-warming-bet&p=5445053&viewfull=1#post5445053), and he insists he can't see any difference in the two versions of the graph depicted below.

(W)hat is moviefan talking about? He claims that the bet was made on a different chart....


In January 2016, NASA officially confirmed that the temperature anomaly had increased by 0.13ºC, which is less than the 0.15ºC we bet on.

NASA said:
Globally-averaged temperatures in 2015 shattered the previous mark set in 2014 by 0.23 degrees Fahrenheit (0.13 Celsius).
https://www.nasa.gov/press-release/...-shattering-global-warm-temperatures-in-2015/

Frankfooter continues to ignore what NASA has posted and continues to insist he sees no difference between the two graphs depicted above.

He also insists that 0.74ºC (the 2014 anomaly on the graph that NASA is now using) plus 0.15ºC equals 0.83ºC.

Most sensible people have rejected his insanity. That includes people who actually share his views on global warming.


The bet was settled on Dec. 20, 2015. Regrettably, Frankfooter has spent 2 1/2 months having a temper tantrum about it.
 

Frankfooter

dangling member
Apr 10, 2015
84,603
19,285
113
I'm not sure if you're referring to the bet or the question in the CBC survey.

In terms of the bet, Frankfooter posted a NASA graph in May 2015 that showed a temperature anomaly for 1995 of 0.43ºC and what was supposedly an all-time high of 0.68ºC in 2014. He bet me whether or not the temperature anomaly would increase by at least a further 0.15ºC to a minimum of 0.83ºC in 2015.
I bet you whether or not 2015 would hit 0.83ºC, the bet was based off of IPCC projections of a 0.4ºC increase over 2 decades from a 1995 start.
We did not bet on a year to year change from 2014.


In July 2015, NASA announced it was using some controversial sea-surface temperature adjustments calculated by NOAA and completely rewrote the graph. Many of us would argue there was a lot of monkey business involved.

http://data.giss.nasa.gov/gistemp/updates_v3/ersst4vs3b/
You are trying to switch charts.
That is not the chart we bet on, we bet on the NASA chart that shows their live results, at this website address:
http://climate.nasa.gov/vital-signs/global-temperature
http://climate.nasa.gov/vital-signs/global-temperature/

If that's the chart you're saying will hit 0.83 at the end of 2015, we definitely have a bet.
You keep trying to switch charts and cheat the bet.
Stick to the chart that you picked for the bet.

You just won't keep your word, will you?
As you stated:

We bet that the temperature anomaly would increase in 2015 to 0.83ºC
You posted a graph that showed a 0.43ºC anomaly for 1995 and we agreed to bet on whether there would be a minimum increase of 0.4ºC over 20 years.

So we bet on the remaining distance from the original 1995 anomaly of 0.43ºC.

NASA reported:
- 2015 anomaly: 0.87ºC
 

Moviefan-2

Court Jester
Oct 17, 2011
10,489
171
63
May 11, 2015:

We might get a bet, once you agree to use one chart for recording the results.

For example, your NASA chart that shows 1995 at 0.43 degrees Celsius put 2014 at 0.68 degrees in 2014: http://climate.nasa.gov/vital-signs/global-temperature/

If that's the chart you're saying will hit 0.83 at the end of 2015, we definitely have a bet.
Ok bets on.
Using that NASA figure of 0.43ºC anomaly for 1995 and waiting for the 2015 NASA anomaly figures to come out.
----

2016:

It was a year-over-year increase of 0.15ºC of the 2014 anomaly from the time of the bet.
We did not bet on a year to year change from 2014.
It takes a certain kind of person to post something that shows himself to be a lying fool.
 

Frankfooter

dangling member
Apr 10, 2015
84,603
19,285
113
Regardless, in terms of the bet, NASA's director responsible for the climate studies confirmed that the current years had all been adjusted at the same rate. That means the 0.15ºC increase that we bet on could be cleanly applied to the new graph.
We had this discussion in June of last year, when these changes came up the first time, and you first tried to 'adjust' the bet.
After which you gave your word you would continue the bet on its original terms, without these same 'adjustments' you tried the first time.

A little moviefan history lesson:
June 17, 2015
Moviefan learns that the year is an El Nino year, starts worrying, then learns that NASA has updated their charts, something they do quite regularly, this time it works in my favour but as NASA notes in the FAQ, it happens and sometimes temps go up and sometimes down.
Does data processing make temperature data warmer?
It can go either way. Almost half of NOAA's corrected data are cooler than the original records. NOAA's corrections of temperatures over the oceans —**done to compensate for changes in methods of observing the temperature of water at the surface of the ocean —**reduced the warming trend in global temperature.
http://climate.nasa.gov/faq/
Moviefan then accuses NASA and NOAA of fraud, runs the numbers through the rigorous denier math model and tries to have the bet changed to 0.86ºC instead of the agreed upon 0.83ºC.
Sorry, but Enron-style accounting doesn't qualify as an actual temperature increase.
..
The adjusted bet is 0.86 degrees Celsius. Take it or leave it.

You have until the end of Sunday to decide whether or not you are taking the adjusted bet.
Stage 2 - moviefan agrees to continue on the original terms

June 17, 2015
Moviefan is accused of trying to weasel out of the agreed bet by changing the terms, finally agrees to continue the bet on its original terms.
In any event, it's settled. The bet that you and I made on May 10, 2015, stands.
Are you a weasel or a man?
Is your word worthless or will you keep it?
 

Moviefan-2

Court Jester
Oct 17, 2011
10,489
171
63
He bet me whether or not the temperature anomaly would increase by at least a further 0.15ºC to a minimum of 0.83ºC in 2015.
I bet you whether or not 2015 would hit 0.83ºC....
It was a year-over-year increase of 0.15ºC of the 2014 anomaly from the time of the bet.
:thumb:

We did not bet on a year to year change from 2014.
It takes a certain kind of person to post something that shows himself to be a lying fool.
 

Frankfooter

dangling member
Apr 10, 2015
84,603
19,285
113
May 11, 2015:

----

2016:
Lets look at your deliberate misquoting in post #194:


Quote Originally Posted by Moviefan-2 View Post
Bullshit.

Here's the complete quote with all three sentences that describe the full terms of the bet, not just one cherry-picked sentence.
Lets look at those three sentences:
We might get a bet, once you agree to use one chart for recording the results.
We both agreed to use this chart:
http://climate.nasa.gov/vital-signs/global-temperature/


For example, your NASA chart that shows 1995 at 0.43 degrees Celsius put 2014 at 0.68 degrees in 2014: http://climate.nasa.gov/vital-signs/global-temperature/

This confirms the use of the chart, and makes the example of 1995's global anomaly to calculate the number upon which the bet is laid.

If that's the chart you're saying will hit 0.83 at the end of 2015, we definitely have a bet.
That is the bet, the confirmation of the NASA chart, with a link included previously, and the number that chart needed to hit for the bet to be decided.


There is no dispute that we bet on a year-over-year increase of at least 0.15ºC. Nor is there any dispute that NASA's new numbers only show a year-over-year increase of 0.10ºC -- one-third less than what we bet on.
It was a year-over-year increase of 0.15ºC of the 2014 anomaly from the time of the bet. But the terms of the bet were clear, they were based on the global anomaly hitting 0.83ºC, not 0.83ºC + 'whatever it takes to make moviefan win'.

You agreed to continue the bet on its original terms, not to change the terms to your 'adjusted' numbers.
Quote Originally Posted by Moviefan-2 View Post
In any event, it's settled. The bet that you and I made on May 10, 2015, stands.

But I'm getting so tired of your whining about this bet that I am considering challenging you to up the stakes and adding in your 'adjusted' target of 0.86ºC.
Those numbers come out in a week or so, are you interested?
That's the original post where your 'year over year' quote comes from.
A post where I specifically deny your claim that the bet was a year over year term.
For you to deliberately misquote me is yet another cheap weasel tactic.

Just man up and admit you lost the bet.
 

Frankfooter

dangling member
Apr 10, 2015
84,603
19,285
113
We bet that the temperature anomaly would increase in 2015 to 0.83ºC
You posted a graph that showed a 0.43ºC anomaly for 1995 and we agreed to bet on whether there would be a minimum increase of 0.4ºC over 20 years.

So we bet on the remaining distance from the original 1995 anomaly of 0.43ºC.

NASA reported:
- 2015 anomaly: 0.87ºC
Are you a weasel or a man?
Is your word worthless or will you keep it?
 
Toronto Escorts