

You are using an out of date browser. It may not display this or other websites correctly.
You should upgrade or use an alternative browser.
You should upgrade or use an alternative browser.


Only Three Months Left For Planet Earth( and other false doomsday predictions)
- Thread starter canada-man
- Start date
^^^^^^^^^^^^ look at all the graphs he's got
Hey, are you lying about having me on ignore?
What a surprise.
Enjoying watching mr science get his ass kicked?
Just wait, he's got more graphs.
All of them pulled from other websites which he doesnt understand a lick about, but they are impressive graphs nonetheless
All of them pulled from other websites which he doesnt understand a lick about, but they are impressive graphs nonetheless
You really don't understand that your claim is based on cherry picking?
No its not.
https://www.ncdc.noaa.gov/cag/nation...dbaseyear=2000
U.S. Temperatures 2019 down 2.25 C from 2016
U.S. Temperatures 2019 down 2.6 C from 2012
Is that really too much for you to understand?
look
The most recent year is 2019, & the temperatures for 2019 are lower than 2016 & 2012 (seven years ago)
That should not have happened if CO2 is the control knob for the climate
It is that simple
You still claim this chart shows declines.
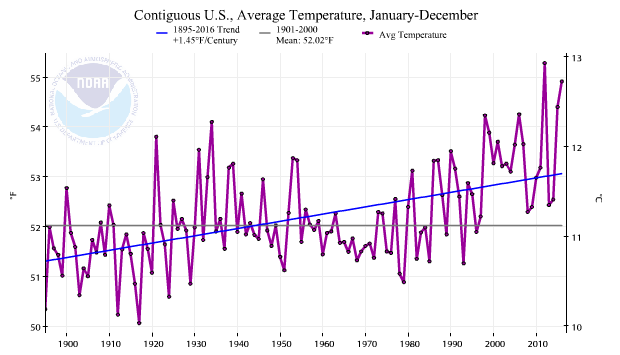
Nice try, that is not my chart
2019 is missing, so is 2018 & 2017
Why do you think you can fool anyone with a cheap childish move like that?
Grow up !
You do not even need a chart
Here is the data
1. U.S. Temperatures 2019 down 2.25 C from 2016
2. U.S. Temperatures 2019 down 2.6 C from 2012
Now answer the questions
In the 7 years since 2012 CO2 has increased , however US temperature have declined. This is inconsistent with your premise and I want you to explain how this could happen
In the 3 years since 2016 CO2 has increased , however US temperature have declined. This is inconsistent with your premise and I want you to explain how this could happen
Seven years is certainly long enough to want to know why?
After all you are demanding we have to change .......... well everything, because you say CO2 is the control knob on climate
I think we are entitled to enquire when your all knowing prediction does not work.
I think seven years is a quite reasonable amount of time ask, " Hey, why is it getting colder , CO2 increased past the all important 0.04% level, yet it is colder by 2.6 degrees celsius in the USA over the last seven years?"
It seems a very reasonable question for anyone to ask
It is as simple as that
Answer the questions
No its not.
https://www.ncdc.noaa.gov/cag/nation...dbaseyear=2000
U.S. Temperatures 2019 down 2.25 C from 2016
U.S. Temperatures 2019 down 2.6 C from 2012
mr science, your link doesn't work.
click on the link in your post and see where it gets you.
That's why I posted other charts, because you cannot format replies, can't use grammar correctly, don't understand the science and can't post a link that actually works.
Here's a working link to the NOAA US temperatures that hasn't been cherry picked to just the last 40 years.
https://www.ncdc.noaa.gov/cag/natio...se_prd=true&begbaseyear=1901&endbaseyear=2000
I can't believe you still don't understand that you are cherry picking dates, so here is the answer to your questions.
1. U.S. Temperatures 2019 down 2.25 C from 2016
2. U.S. Temperatures 2019 down 2.6 C from 2012
The denier site you copied from picked the two biggest peaks and two biggest low points to cherry pick your claim, yet you still aren't bright enough to understand what you copied and pasted.
Instead you keep repeating it, showing that, like copyandpasteman, you are capable only of copying arguments, not understanding them.
Example 1 - you picked 2016 (peak year) to 2019 (coolest year in a few years). move your dates 3 years earlier and all of a sudden you show massive warming.
2013-2016 - increase of 2.5ºF
2016-2019 - decrease of 2.2ºF
Your claim only works if you cherry pick the warmest year to the next coolest year because the rest of the chart shows the same warming we've seen in every other fucking chart here.
Example 2 - try the seven years before your start date and again that 7 year period shows warming, not cooling.
2005 - 2012 - 1.8ºF warmer
2012 - 2019 - 2.7ºF cooler
Obviously there is no long term warming trend and the place you copied and pasted your argument from picked the warmest year to the coolest year to fool suckers like you.
I don't fall for that shit.
That shit is really stupid.
But what's even more sad is despite me explaining this to you 3 times in three different ways you still don't understand what you copied.
That makes you worse than CM, as when you corner him he just ignores it and pastes some different claim from his denier sites, until he got so ashamed that he had to put me on ignore.
Kind of like phil pretends to do, because he's been embarrassed here too many times to keep trying that shit with me.
But you?
That's sad.
mr science, your link doesn't work.
click on the link in your post and see where it gets you.
You deny the chart's existence because you cant fix a link ?
Here it
https://www.ncdc.noaa.gov/cag/natio...se_prd=true&begbaseyear=1901&endbaseyear=2000
Here are the numbers you need
1. U.S. Temperatures 2019 down 2.25 C from 2016
2. U.S. Temperatures 2019 down 2.6 C from 2012
Now answer the questions
In the 7 years since 2012 CO2 has increased , however US temperature have declined. This is inconsistent with your premise and I want you to explain how this could happen
In the 3 years since 2016 CO2 has increased , however US temperature have declined. This is inconsistent with your premise and I want you to explain how this could happen
Seven years is certainly long enough to want to know why?
After all you are demanding we have to change .......... well everything, because you say CO2 is the control knob on climate
I think we are entitled to enquire when your all-knowing prediction does not work.
I think seven years is a quite reasonable amount of time ask, " Hey, why is it getting colder , CO2 increased past the all important 0.04% level, yet it is colder by 2.6 degrees celsius in the USA over the last seven years?"
It seems a very reasonable question for anyone to ask
It is as simple as that
Answer the questions
You deny the chart's existence because you cant fix a link ?
Here it
https://www.ncdc.noaa.gov/cag/natio...se_prd=true&begbaseyear=1901&endbaseyear=2000
Here are the numbers you need
1. U.S. Temperatures 2019 down 2.25 C from 2016
2. U.S. Temperatures 2019 down 2.6 C from 2012
Now answer the questions
In the 7 years since 2012 CO2 has increased , however US temperature have declined. This is inconsistent with your premise and I want you to explain how this could happen
In the 3 years since 2016 CO2 has increased , however US temperature have declined. This is inconsistent with your premise and I want you to explain how this could happen
Seven years is certainly long enough to want to know why?
After all you are demanding we have to change .......... well everything, because you say CO2 is the control knob on climate
I think we are entitled to enquire when your all-knowing prediction does not work.
I think seven years is a quite reasonable amount of time ask, " Hey, why is it getting colder , CO2 increased past the all important 0.04% level, yet it is colder by 2.6 degrees celsius in the USA over the last seven years?"
It seems a very reasonable question for anyone to ask
It is as simple as that
Answer the questions
mr science, I answered the questions with direct numbers from your link.
And its obvious you just copied and pasted claims from another site and haven't been able to understand the points in your question.
Your numbers refer to Celsius temps but the link gives out clear numbers for Fahrenheit when you click on years.
Which is why my rebuttal is in ºF while your claim is clearly not from actually looking at the chart but from copying pasting from some denier site.
That also explains why you are totally unable to understand that you look incredibly foolish posting the same claim without understanding when you've been out argued.
So, once more.
I can't believe you still don't understand that you are cherry picking dates, so here is the answer to your questions.
1. U.S. Temperatures 2019 down 2.25 C from 2016
2. U.S. Temperatures 2019 down 2.6 C from 2012
The denier site you copied from picked the two biggest peaks and two biggest low points to cherry pick your claim, yet you still aren't bright enough to understand what you copied and pasted.
Instead you keep repeating it, showing that, like copyandpasteman, you are capable only of copying arguments, not understanding them.
Example 1 - you picked 2016 (peak year) to 2019 (coolest year in a few years). move your dates 3 years earlier and all of a sudden you show massive warming.
2013-2016 - increase of 2.5ºF
2016-2019 - decrease of 2.2ºF
Your claim only works if you cherry pick the warmest year to the next coolest year because the rest of the chart shows the same warming we've seen in every other fucking chart here.
Example 2 - try the seven years before your start date and again that 7 year period shows warming, not cooling.
2005 - 2012 - 1.8ºF warmer
2012 - 2019 - 2.7ºF cooler
Obviously there is no long term warming trend and the place you copied and pasted your argument from picked the warmest year to the coolest year to fool suckers like you.
I don't fall for that shit.
That shit is really stupid.
But what's even more sad is despite me explaining this to you 3 times in three different ways you still don't understand what you copied.
That makes you worse than CM, as when you corner him he just ignores it and pastes some different claim from his denier sites, until he got so ashamed that he had to put me on ignore.
Kind of like phil pretends to do, because he's been embarrassed here too many times to keep trying that shit with me.
But you?
That's sad.
mr science, I answered the questions with direct numbers from your link.
No you did not
Here are the numbers you need
1. U.S. Temperatures 2019 down 2.25 C from 2016
2. U.S. Temperatures 2019 down 2.6 C from 2012
Now answer the questions
In the 7 years since 2012 CO2 has increased , however US temperature have declined. This is inconsistent with your premise and I want you to explain how this could happen
In the 3 years since 2016 CO2 has increased , however US temperature have declined. This is inconsistent with your premise and I want you to explain how this could happen
Seven years is certainly long enough to want to know why?
After all you are demanding we have to change .......... well everything, because you say CO2 is the control knob on climate
I think we are entitled to enquire when your all-knowing prediction does not work.
I think seven years is a quite reasonable amount of time ask, " Hey, why is it getting colder , CO2 increased past the all important 0.04% level, yet it is colder by 2.6 degrees celsius in the USA over the last seven years?"
It seems a very reasonable question for anyone to ask
It is as simple as that
Answer the questions
No you did not
Yes I did.
As noted, you quoted your numbers in Celsius while the link you posted uses Fahrenheit, showing that you are just copying your homework again and don't understand it.
The denier site you copied from picked the two biggest peaks and two biggest low points to cherry pick your claim, yet you still aren't bright enough to understand what you copied and pasted.
Instead you keep repeating it, showing that, like copyandpasteman, you are capable only of copying arguments, not understanding them.
Example 1 - you picked 2016 (peak year) to 2019 (coolest year in a few years). move your dates 3 years earlier and all of a sudden you show massive warming.
2013-2016 - increase of 2.5ºF
2016-2019 - decrease of 2.2ºF
Your claim only works if you cherry pick the warmest year to the next coolest year because the rest of the chart shows the same warming we've seen in every other fucking chart here.
Example 2 - try the seven years before your start date and again that 7 year period shows warming, not cooling.
2005 - 2012 - 1.8ºF warmer
2012 - 2019 - 2.7ºF cooler
Obviously there is no long term warming trend and the place you copied and pasted your argument from picked the warmest year to the coolest year to fool suckers like you.
I don't fall for that shit.
That shit is really stupid.
But what's even more sad is despite me explaining this to you 3 times in three different ways you still don't understand what you copied.
That makes you worse than CM, as when you corner him he just ignores it and pastes some different claim from his denier sites, until he got so ashamed that he had to put me on ignore.
Kind of like phil pretends to do, because he's been embarrassed here too many times to keep trying that shit with me.
Your question has been answered multiple times.
Your claim is bullshit.
Yes I did.
No you did not
Here are the numbers you need
1. U.S. Temperatures 2019 down 2.25 C from 2016
2. U.S. Temperatures 2019 down 2.6 C from 2012
Now answer the questions
In the 7 years since 2012 CO2 has increased , however US temperature have declined. This is inconsistent with your premise and I want you to explain how this could happen
In the 3 years since 2016 CO2 has increased , however US temperature have declined. This is inconsistent with your premise and I want you to explain how this could happen
Seven years is certainly long enough to want to know why?
After all you are demanding we have to change .......... well everything, because you say CO2 is the control knob on climate
I think we are entitled to enquire when your all-knowing prediction does not work.
I think seven years is a quite reasonable amount of time ask, " Hey, why is it getting colder , CO2 increased past the all important 0.04% level, yet it is colder by 2.6 degrees celsius in the USA over the last seven years?"
It seems a very reasonable question for anyone to ask
It is as simple as that
Answer the questions
No you did not
Here are the numbers you need
1. U.S. Temperatures 2019 down 2.25 C from 2016
2. U.S. Temperatures 2019 down 2.6 C from 2012
larue, your question is answered using the numbers from the link you provided, which gives them in Fahrenheit, not Celsius.
The numbers you quoted are wrong, because you said they were Celsius.
Which makes your question itself wrong.
The correct numbers and answer is below.
Again.
Example 1 - you picked 2016 (peak year) to 2019 (coolest year in a few years). move your dates 3 years earlier and all of a sudden you show massive warming.
2013-2016 - increase of 2.5ºF
2016-2019 - decrease of 2.2ºF
Your claim only works if you cherry pick the warmest year to the next coolest year because the rest of the chart shows the same warming we've seen in every other fucking chart here.
Example 2 - try the seven years before your start date and again that 7 year period shows warming, not cooling.
2005 - 2012 - 1.8ºF warmer
2012 - 2019 - 2.7ºF cooler
Obviously there is no long term warming trend and the place you copied and pasted your argument from picked the warmest year to the coolest year to fool suckers like you.
I don't fall for that shit.
That shit is really stupid.
But what's even more sad is despite me explaining this to you 3 times in three different ways you still don't understand what you copied.
That makes you worse than CM, as when you corner him he just ignores it and pastes some different claim from his denier sites, until he got so ashamed that he had to put me on ignore.
Kind of like phil pretends to do, because he's been embarrassed here too many times to keep trying that shit with me.
Your question has been answered multiple times.
Your claim is bullshit.

Wind Turbines Not Only Shred Birds But Are Piling Up Landfills
As it turns out, wind energy may not be as eco-friendly as the environmentalists let on. Not only are they 24/7 bird-killing machines, they are also now piling up in landfills because they cannot be recycled.
“The municipal landfill in Casper, Wyoming, is the final resting place of 870 blades whose days making renewable energy have come to end. The severed fragments look like bleached whale bones nestled against one another,” reports Bloomberg Green.
Even the disposing of a turbine blade expels tremendous energy, being that they have to be hauled away and must be sawed through with “a diamond-encrusted industrial saw to create three pieces small enough to be strapped to a tractor-trailer.”
“Tens of thousands of aging blades are coming down from steel towers around the world and most have nowhere to go but landfills,” continued Bloomberg. “In the U.S. alone, about 8,000 will be removed in each of the next four years. Europe, which has been dealing with the problem longer, has about 3,800 coming down annually through at least 2022, according to BloombergNEF. It’s going to get worse: Most were built more than a decade ago, when installations were less than a fifth of what they are now.”
The blades were built to “withstand hurricane-force winds” and cannot be “crushed, recycled, or repurposed.” In places that lack the land-space to hold such waste, the search for alternative materials is now underway. Bob Cappadona, the North American chief operating officer for Veolia Environnement SA, said the wind turbines will be in those landfills “forever.”
“The wind turbine blade will be there, ultimately, forever,” saidCappadona. “Most landfills are considered a dry tomb. The last thing we want to do is create even more environmental challenges.”
One solution has been provided by the European Union, which burns some windmill blades in kilns that “create cement or in power plants.” The drawback, however: “their energy content is weak and uneven and the burning fiberglass emits pollutants.”
https://www.dailywire.com/news/wind-turbines-not-only-shred-birds-but-are-piling-up-landfills
As it turns out, wind energy may not be as eco-friendly as the environmentalists let on. Not only are they 24/7 bird-killing machines, they are also now piling up in landfills because they cannot be recycled.
“The municipal landfill in Casper, Wyoming, is the final resting place of 870 blades whose days making renewable energy have come to end. The severed fragments look like bleached whale bones nestled against one another,” reports Bloomberg Green.
Even the disposing of a turbine blade expels tremendous energy, being that they have to be hauled away and must be sawed through with “a diamond-encrusted industrial saw to create three pieces small enough to be strapped to a tractor-trailer.”
“Tens of thousands of aging blades are coming down from steel towers around the world and most have nowhere to go but landfills,” continued Bloomberg. “In the U.S. alone, about 8,000 will be removed in each of the next four years. Europe, which has been dealing with the problem longer, has about 3,800 coming down annually through at least 2022, according to BloombergNEF. It’s going to get worse: Most were built more than a decade ago, when installations were less than a fifth of what they are now.”
The blades were built to “withstand hurricane-force winds” and cannot be “crushed, recycled, or repurposed.” In places that lack the land-space to hold such waste, the search for alternative materials is now underway. Bob Cappadona, the North American chief operating officer for Veolia Environnement SA, said the wind turbines will be in those landfills “forever.”
“The wind turbine blade will be there, ultimately, forever,” saidCappadona. “Most landfills are considered a dry tomb. The last thing we want to do is create even more environmental challenges.”
One solution has been provided by the European Union, which burns some windmill blades in kilns that “create cement or in power plants.” The drawback, however: “their energy content is weak and uneven and the burning fiberglass emits pollutants.”
https://www.dailywire.com/news/wind-turbines-not-only-shred-birds-but-are-piling-up-landfills
3 points:
1. British scientist: "Records get broken just because things fluctuate naturally."
2. The Thwaites glacier is atop volcanic activity.
3. The 'record' was directly caused by a ‘foehn’ event -- rapid warming of air coming down a slope.
Antarctica hits record high temperature of 18.3C
https://www.thetimes.co.uk/article/antarctica-hits-record-high-temperature-of-18-3c-f0nfss25g
1. British scientist: "Records get broken just because things fluctuate naturally."
2. The Thwaites glacier is atop volcanic activity.
3. The 'record' was directly caused by a ‘foehn’ event -- rapid warming of air coming down a slope.
Antarctica hits record high temperature of 18.3C
https://www.thetimes.co.uk/article/antarctica-hits-record-high-temperature-of-18-3c-f0nfss25g
Wind Turbines Not Only Shred Birds But Are Piling Up Landfills
Then why is coal generation dying and more wind and solar going up than anything else?'
Could it be you're just posting propaganda again?
3 points:
Antarctica hits record high temperature of 18.3C
That's the point.
And related:
The world's largest iceberg has started drifting away
https://www.ctvnews.ca/sci-tech/the-world-s-largest-iceberg-has-started-drifting-away-1.4800168
larue, your question is answered using the numbers from the link you provided, which gives them in Fahrenheit, not Celsius.
The numbers you quoted are wrong, because you said they were Celsius.
Which makes your question itself wrong.
The correct numbers and answer is below.
Again.
Your claim is bullshit.
You cant convert F to C?
Here are the numbers you need
1. U.S. Temperatures 2019 down 2.25 C from 2016
2. U.S. Temperatures 2019 down 2.6 C from 2012
Now answer the questions
In the 7 years since 2012 CO2 has increased , however US temperature have declined. This is inconsistent with your premise and I want you to explain how this could happen
In the 3 years since 2016 CO2 has increased , however US temperature have declined. This is inconsistent with your premise and I want you to explain how this could happen
Seven years is certainly long enough to want to know why?
After all you are demanding we have to change .......... well everything, because you say CO2 is the control knob on climate
I think we are entitled to enquire when your all-knowing prediction does not work.
I think seven years is a quite reasonable amount of time ask, " Hey, why is it getting colder , CO2 increased past the all important 0.04% level, yet it is colder by 2.6 degrees celsius in the USA over the last seven years?"
It seems a very reasonable question for anyone to ask
It is as simple as that
Answer the questions
You cant convert F to C?
Here are the numbers you need
1. U.S. Temperatures 2019 down 2.25 C from 2016
2. U.S. Temperatures 2019 down 2.6 C from 2012
Hey mr science, you can't read a chart.
Those numbers are not on the chart you posted.
Here you are going on and on and you can't even read the fricking chart you linked to and tried to quote from.
https://www.ncdc.noaa.gov/cag/natio...se_prd=true&begbaseyear=1901&endbaseyear=2000
Why would you expect anyone to take you seriously when you posted the same question over and over again yet still can't understand that you got the numbers wrong and that your claim is typical larue bullshit?
Hey mr science, you can't read a chart.
Those numbers are not on the chart you posted.
Here you are going on and on and you can't even read the fricking chart you linked to and tried to quote from.
https://www.ncdc.noaa.gov/cag/natio...se_prd=true&begbaseyear=1901&endbaseyear=2000
Why would you expect anyone to take you seriously when you posted the same question over and over again yet still can't understand that you got the numbers wrong and that your claim is typical larue bullshit?
You cant convert F to C?
Here are the numbers you need
1. U.S. Temperatures 2019 down 2.25 C from 2016
2. U.S. Temperatures 2019 down 2.6 C from 2012
Now answer the questions
In the 7 years since 2012 CO2 has increased , however US temperature have declined. This is inconsistent with your premise and I want you to explain how this could happen
In the 3 years since 2016 CO2 has increased , however US temperature have declined. This is inconsistent with your premise and I want you to explain how this could happen
Seven years is certainly long enough to want to know why?
After all you are demanding we have to change .......... well everything, because you say CO2 is the control knob on climate
I think we are entitled to enquire when your all-knowing prediction does not work.
I think seven years is a quite reasonable amount of time ask, " Hey, why is it getting colder , CO2 increased past the all important 0.04% level, yet it is colder by 2.6 degrees celsius in the USA over the last seven years?"
It seems a very reasonable question for anyone to ask
It is as simple as that
Answer the questions

This image shows the change in leaf area across the globe from 1982-2015. CREDIT Credits: Boston University/R. Myneni
Source: http://www.nature.com/nclimate/journal/vaop/ncurrent/full/nclimate3004.html
It seems the Earth’s biosphere is responding to increased CO2 in a positive way, that’s also undeniable.
Mr Science, aka Johnnylarue, you got the fucking numbers wrong.
You didn't read your chart correctly and you keep posting the same fucking error daily here.
And every time I politely corrected your posts you didn't notice the error you made, insulted me and reposted the same mistakes.
Read the chart that you linked to and check the numbers.
Oh, and while you're checking the numbers, check to see what measurement unit they used in the numbers you quoted.
After you've done that, come back here and apologize for every single insult you've posted here in this thread.
Read your chart and stop posting the wrong numbers!
Wrong numbers, the chart is in Fahrenheit and your numbers are from the Fahrenheit measurements.
Wrong numbers, the chart is in Fahrenheit and your numbers are from the Fahrenheit measurements.
Wrong numbers, the chart is in Fahrenheit, your first number should be 2.25ºF.
Wrong numbers, the chart is in Fahrenheit, your first number should be 2.25ºF.
Wrong numbers, the chart is in Fahrenheit, your first number should be 2.25ºF.
Wrong numbers, the chart is in Fahrenheit, your first number should be 2.25ºF.
Wrong numbers, the chart is in Fahrenheit and your numbers are from the Fahrenheit measurements.
Wrong numbers, the chart is in Fahrenheit and your numbers are from the Fahrenheit measurements.
You didn't read your chart correctly and you keep posting the same fucking error daily here.
And every time I politely corrected your posts you didn't notice the error you made, insulted me and reposted the same mistakes.
Read the chart that you linked to and check the numbers.
Oh, and while you're checking the numbers, check to see what measurement unit they used in the numbers you quoted.
After you've done that, come back here and apologize for every single insult you've posted here in this thread.
Read your chart and stop posting the wrong numbers!
Here are the numbers you need
1. U.S. Temperatures 2019 down 2.25 C from 2016
2. U.S. Temperatures 2019 down 2.6 C from 2012
Wrong numbers, the chart is in Fahrenheit and your numbers are from the Fahrenheit measurements.
https://www.ncdc.noaa.gov/cag/nation...dbaseyear=2000
U.S. Temperatures 2019 down 2.25 C from 2016
U.S. Temperatures 2019 down 2.6 C from 2012
Wrong numbers, the chart is in Fahrenheit and your numbers are from the Fahrenheit measurements.
https://www.ncdc.noaa.gov/cag/nation...dbaseyear=2000
U.S. Temperatures 2019 down 2.25 C from 2016
U.S. Temperatures 2019 down 2.6 C from 2012
OK Stupid, lets take a look
I asked you two simple questions
https://www.ncdc.noaa.gov/cag/nation...dbaseyear=2000
U.S. Temperatures 2019 down 2.25 C from 2016
U.S. Temperatures 2019 down 2.6 C from 2012
Well for starters its true. The US temperatures have decreased from 2012 to 2019
U.S. Temperatures 2019 down 2.25 C from 2016
U.S. Temperatures 2019 down 2.6 C from 2012
Anyone but a moron can look at that chart and see that these statements are factually correct
Wrong numbers, the chart is in Fahrenheit, your first number should be 2.25ºF.
https://www.ncdc.noaa.gov/cag/nation...dbaseyear=2000
U.S. Temperatures 2019 down 2.25 C from 2016
U.S. Temperatures 2019 down 2.6 C from 2012
1. U.S. Temperatures 2019 down 2.25 C from 2016
2. U.S. Temperatures 2019 down 2.6 C from 2012
Wrong numbers, the chart is in Fahrenheit, your first number should be 2.25ºF.
Y
https://www.ncdc.noaa.gov/cag/natio...se_prd=true&begbaseyear=1901&endbaseyear=2000
Here are the numbers you need
1. U.S. Temperatures 2019 down 2.25 C from 2016
2. U.S. Temperatures 2019 down 2.6 C from 2012
Wrong numbers, the chart is in Fahrenheit, your first number should be 2.25ºF.
Here are the numbers you need
1. U.S. Temperatures 2019 down 2.25 C from 2016
2. U.S. Temperatures 2019 down 2.6 C from 2012
Wrong numbers, the chart is in Fahrenheit, your first number should be 2.25ºF.
Here are the numbers you need
1. U.S. Temperatures 2019 down 2.25 C from 2016
2. U.S. Temperatures 2019 down 2.6 C from 2012
Wrong numbers, the chart is in Fahrenheit and your numbers are from the Fahrenheit measurements.
Here are the numbers you need
1. U.S. Temperatures 2019 down 2.25 C from 2016
2. U.S. Temperatures 2019 down 2.6 C from 2012
Wrong numbers, the chart is in Fahrenheit and your numbers are from the Fahrenheit measurements.
Similar threads
- Replies
- 2
- Views
- 438
- Replies
- 7
- Views
- 433
- Replies
- 2
- Views
- 288
- Replies
- 4
- Views
- 550
