

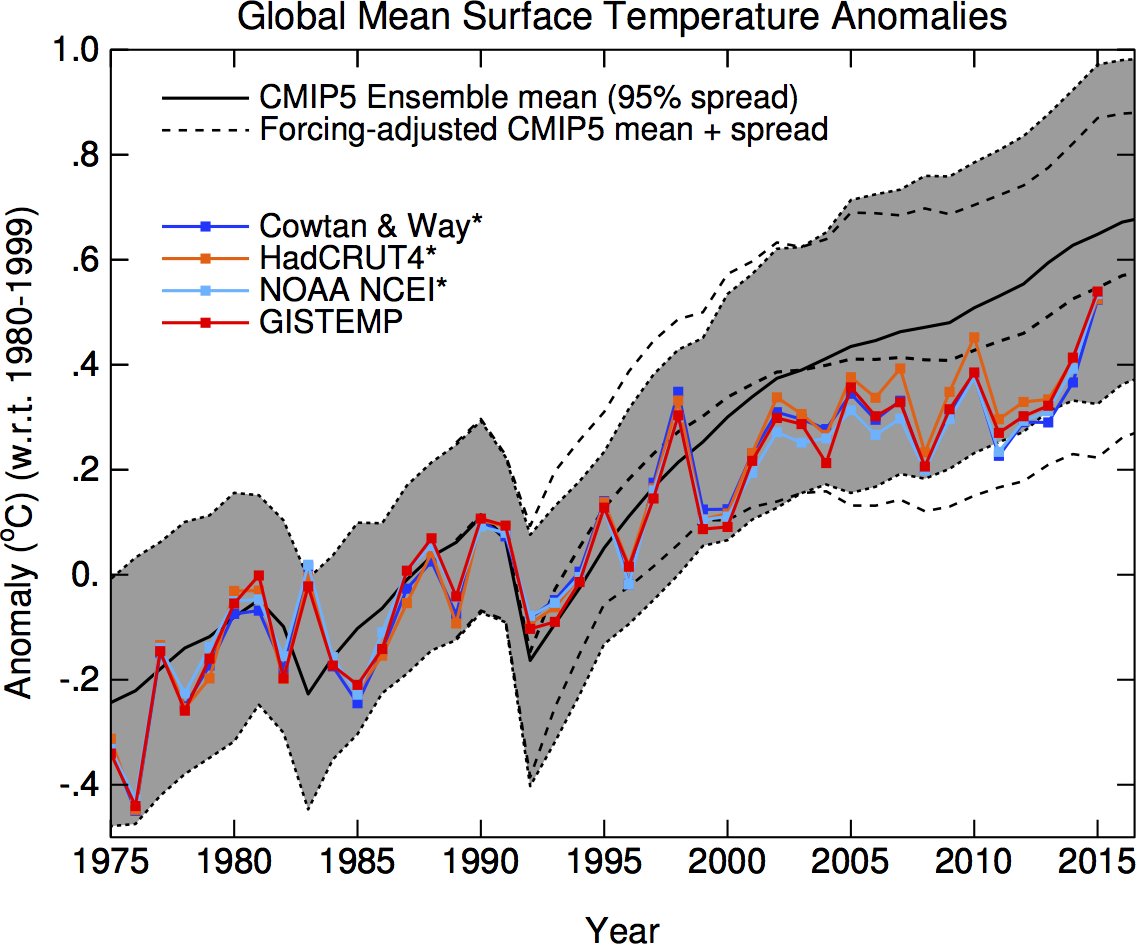
Here's a tweet from Gavin Schmidt you should enjoy:Gavin Schmidt's graph from Feb. 24, 2016,
https://twitter.com/ClimateOfGavin/status/702558277918392321


Here's a tweet from Gavin Schmidt you should enjoy:Gavin Schmidt's graph from Feb. 24, 2016,
Because it only has 2 fucking years of projection you dumb fuck.
Typo's aside, have you taken the time to read the Nature article yet?
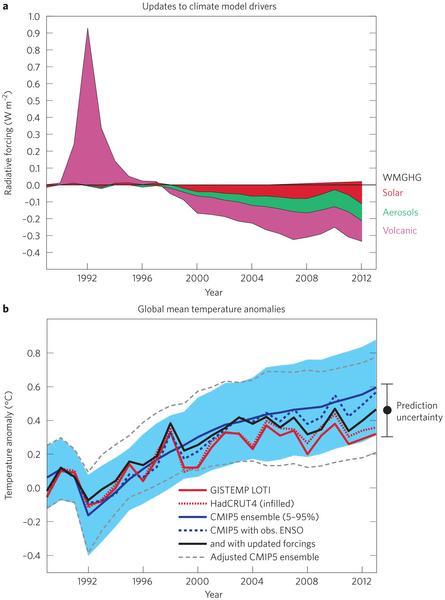
There are things that can't predicted, like volcanoes, that are 'natural forcings'. Adjusting the projection for those shows the accuracy of the projection itself.

I watched the first minute and a half before I realized what nonsense that is, here's why:
1) Its a chart of mid-tropospheric temperatures - that's mid-atmosphere, while we mostly talk about surface temperatures
2) they accuse those who wrote the chart of 'cherry picking' the start date of 1978, which is idiotic. That data comes from satellite data that wasn't available before 1978, and its known to be less reliable then surface temperature.
3) he says the chart starts and ends near the same temperature, that is what is called 'cherry picking', and it ignores the averages of the chart that clearly show warming, and it also requires even more cherry picking because the real start and of the chart would also show warming.
Why is it that such basic flawed claims fool people?
You so full of shit like usual. This graph mid-atmosphere was presented by the
obama's science advisor Dr. Holdren during the white house presentation to the American people.
Obama Science Rick holdrem's chart picture was captured or freezed framed and they Pat & Stu analazyed and it show all the flaws and the lies that they the obama science adivisor's Dr Rick Holerem's did on the graph by manuipalating the angles of the graph and shorting the lines of the graph of the tracjetory of the begining and the ending of the graph and to make the tracjetory look more steeper the angle of acend raising alot worse which show more warming>
The article confirmed what I have been saying all along.
From the nature article.it does not in any way undermine global-warming theory.
There are things that can't be predicted, such as what impact -- if any -- man-made emissions are having on the Earth's temperature.
(And at the risk of sounding immodest, I met Frankfooter's challenge to prove his graph is "not accurate," even though Frankfooter never provided the source of the graph. :thumb
Why don't you answer me why obama science advisor tilted the graph in the chart ? Answer why theyLook, if you can't raise a counter argument to the points I made, then all you're doing is repeating something you saw on youtube. Clearly you don't understand what you are talking about or you would be able to debate the points.
How can you take someone serious when they claim that the chart was made by 'cherry picking' dates when the chart starts when satellite data first became available?
Why are they basing their claims on less reliable mid atmospheric measurements instead of surface temperatures?
Those are basic points, why can't you answer them ?
It takes a total lack of understanding to equate those two forcings.
Why don't you answer me why obama science advisor tilted the graph in the chart ?
Answer why they
did omaba science Science Advisor's Dr Holdren adviser cherry pick end date differently Clearing anyone can read this chart in the video.
Answer what is presented in the video!!
...
I read the article before I posted it...
Strange. Then why did you ignore all the parts of it that completely disagreed with your claims?
I assume this is another reference to the imaginary quotes you've been making up for me.
it does not in any way undermine global-warming theory.
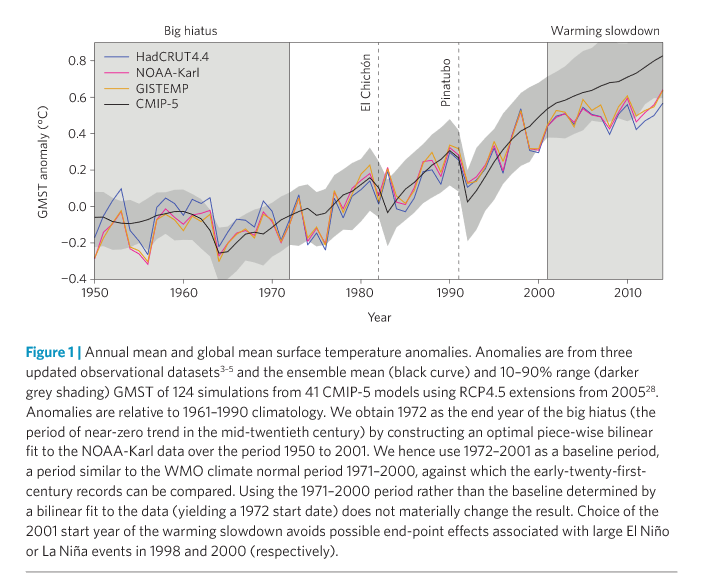

Here's something rather interesting. It's the graph that appears in the paper by Fyfe, Mann and crew (which, by the way, includes the term "hiatus").
What it clearly shows is that the temperature anomalies in the 21st century fell well short of the model-run predictions (the solid black line).
It also clearly refutes the NOAA's "pause buster" paper from last year.
This statement calls into question moviefan's claims, as once again he is making claims that are contradicted by the authors.it does not in any way undermine global-warming theory.
Fyfe's paper is a bit controversial, the finding's aren't yet confirmed....
There's no doubt the findings are controversial.
However, it's important to remember that the Fyfe paper confirms what almost all of the research has shown in recent years. It was the Karl paper -- the so-called "pause buster" -- that was out of sync (and that had findings that even the Met Office and IPCC researchers were disputing).
In any event, whether there has been a hiatus or not, what remains clear is that the IPCC's predictions have been consistently and spectacularly wrong.
The temperature anomalies fit within the range of the models.
We bet that the temperature anomaly would increase in 2015 to 0.83ºC
Just as you also know that NASA reported the temp anomaly as 0.87ºC.The bet was based on the IPCC's predictions of temperature increases of 0.2ºC per decade
Its ridiculous you are still trying to make the same false claims after losing the bet on this issue.
