Dream Spa
Toronto Escorts

CBC report - Most Canadians don't think humans are the main cause of climate change

Moviefan-2

Court Jester
Oct 17, 2011
10,489
171
63
Our projection and data has been based off of NASA's data and baseline, 1951-1980.
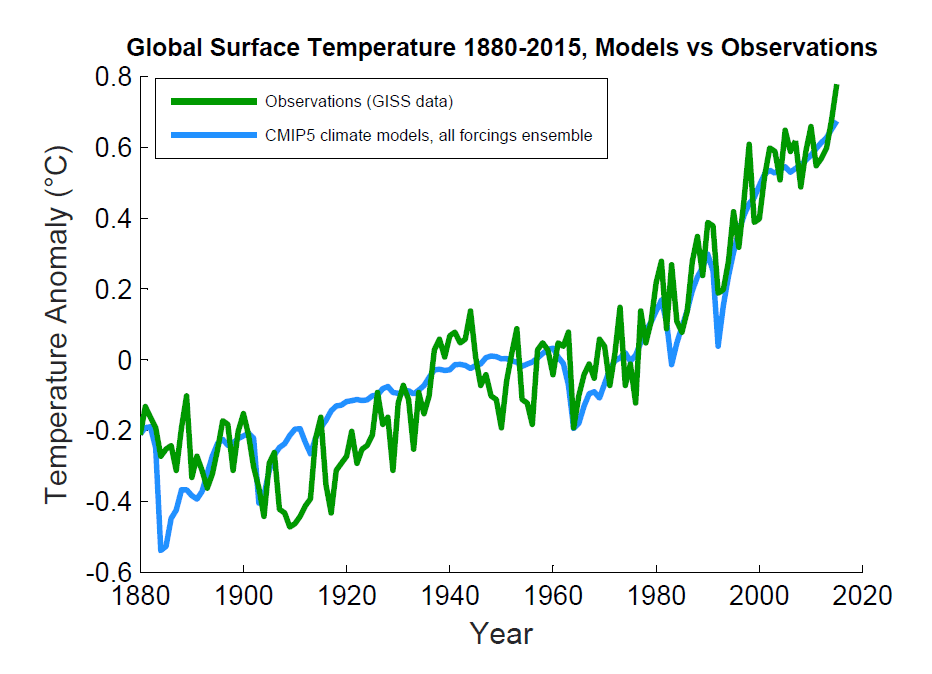
Bullshit. The quote you cited on Feb. 24 about the 0.85ºC prediction (https://terb.cc/vbulletin/showthrea...-HottestYear&p=5417597&viewfull=1#post5417597) was in response to your Hotwhopper graph, which was using the HadCRUT4 data and the 1961 to 1990 baseline.

And for bonus, here's a chart of projections vs reality, which you still claim are 'spectacularly wrong'.
Using the same baseline:

IPCC prediction: 0.85ºC
Final 2015 anomaly: 0.75ºC.

Fact: 0.75ºC is less than 0.85ºC.

The IPCC's predictions remain consistently and spectacularly wrong.
 

Frankfooter

dangling member
Apr 10, 2015
84,605
19,285
113
Denial 101


http://blog.hotwhopper.com/2016/02/global-surface-warming-continues.html

Hotwhopper, meet Frankfooter and Basketcase.

As I said, I suspect what Hotwhopper actually meant is that he's never met anyone who actually knows how to read a graph "who disputes the fact there was a short term slowdown in surface warming."

:biggrin1:
You do realize that I posted a link and already discussed that post earlier, don't you?
And that the article you think contradicts me actually states this:
There was no "hiatus" or stopping of global warming, contrary to Anthony Watts' headline.
And this:
When climate models are populated with the observed forcings, then models match observations.
Science deniers beat up the slowdown and paint it as "global warming stopped", when it didn't and hasn't, aka seeps and scams.
http://blog.hotwhopper.com/2016/02/global-surface-warming-continues.html

Same source as the chart above (which comes from an article and study in Nature).

You just posted an article which calls you a liar as your own defence.
What a douchebag.
 

Moviefan-2

Court Jester
Oct 17, 2011
10,489
171
63
You do realize that I posted a link and already discussed that post earlier, don't you?
Sure do.

And it was in that article that Hotwhopper said he's never met anyone who disputes that there was a slowdown in surface warming.

Clearly, he's never met you or Basketcase.
 

Frankfooter

dangling member
Apr 10, 2015
84,605
19,285
113
Sure do.

And it was in that article that Hotwhopper said he's never met anyone who disputes that there was a slowdown in surface warming.

Clearly, he's never met you or Basketcase.
You are still making really basic and stupid mistakes.
A slowdown in warming means that warming was still happening, it just wasn't as fast for a while.
That's not a pause or a hiatus.

From the original Nature article:
Fyfe uses the term “slowdown” rather than “hiatus” and stresses that it does not in any way undermine global-warming theory.
And again, the quotes you posted from hotwhopper show that you posted an article which calls you a liar as your own defence.
What a douchebag.
 

Moviefan-2

Court Jester
Oct 17, 2011
10,489
171
63

Frankfooter

dangling member
Apr 10, 2015
84,605
19,285
113
Bullshit. The quote you cited on Feb. 24 about the 0.85ºC prediction (https://terb.cc/vbulletin/showthrea...-HottestYear&p=5417597&viewfull=1#post5417597) was in response to your Hotwhopper graph, which was using the HadCRUT4 data and the 1961 to 1990 baseline.


Using the same baseline:

IPCC prediction: 0.85ºC
Final 2015 anomaly: 0.75ºC.

Fact: 0.75ºC is less than 0.85ºC.

The IPCC's predictions remain consistently and spectacularly wrong.
You picked a chart I posted in November for your claim about 2015's anomaly?
https://terb.cc/vbulletin/showthrea...-HottestYear&p=5410384&viewfull=1#post5410384

You are using old charts and mismatching data, very lame.
This is the up to date chart that includes 2015's full data from the same source, tell me its not accurate:


Frankfooter

dangling member
Apr 10, 2015
84,605
19,285
113
So, the IPCC's predictions of warming that would be at least the same or likely much greater were completely wrong.
You are really stupid.
There are periods where it increases very quickly and periods where it increases slowly, check the chart, its a squiggly line, not a straight line.
Natural forcings, like volcanoes, vary the increase, but its still been increasing.


Moviefan-2

Court Jester
Oct 17, 2011
10,489
171
63
You picked a chart I posted in November for your claim about 2015's anomaly?
No, I picked that graph to show you where the calculation of the IPCC's prediction came from.

The final 2015 anomaly was calculated by the Met Office and publicly reported by the Met Office and the BBC (and others, I'm sure).

http://www.bbc.com/news/science-environment-35354579

Using the same baseline:

IPCC prediction: 0.85ºC
Final 2015 anomaly: 0.75ºC.

Fact: 0.75ºC is less than 0.85ºC.

The IPCC's predictions remain consistently and spectacularly wrong.
 

basketcase

Well-known member
Dec 29, 2005
60,354
6,468
113
Sorry, you're so deluded that you don't even know what science is. I'm not even going to argue with you because you obviously won't listen to anything unless it agrees with your religion.
So what hypothesis do you want to test that better explains the changes in climate?

About 15 years ago I gave some credibility to solar activity as the main driver but that theory proved to be completely incapable of matching observations. That leaves us with AGW as the best theory.

p.s. Have you even bothered to read the Nature article or are you like movie and happy to give uniformed opinions?
 

bishop

Banned
Nov 26, 2002
1,800
0
36
So you took an older chart and compared it to new data, then took a number from the Met and compared it to a number you read off a chart?


Again, you took an older chart with incomplete data and compared it the complete year data.
Stop using out of date charts, its dishonest.

The projections were quite accurate, as you know from the bet you lost.
Here is a chart that you call 'spectacularly inaccurate'.

Frank I have already pointed out to you in a previous post that CIMP5 was released at the end of 2013, so at best it has only 2 years worth of your "quite accurate" projections. Even after I pointed it out to you, you still post up the same graph say the projection are "quite accurate", at this point I do not know if it is primarily due to stupidity or dishonesty.
 

Frankfooter

dangling member
Apr 10, 2015
84,605
19,285
113

Frankfooter

dangling member
Apr 10, 2015
84,605
19,285
113
Frank I have already pointed out to you in a previous post that CIMP5 was released at the end of 2013, so at best it has only 2 years worth of your "quite accurate" projections. Even after I pointed it out to you, you still post up the same graph say the projection are "quite accurate", at this point I do not know if it is primarily due to stupidity or dishonesty.
And bishop, I have already pointed out that we have show earlier projections to be just as accurate. Here's a chart of an earlier projection, CMIP3, that even has a line showing when the projection was made and how it fared compared to reality.


Moviefan-2

Court Jester
Oct 17, 2011
10,489
171
63
That chart shows the global anomaly to fit entirely within the projection range, and puts 2015's numbers smack on the dots for the projection with natural forcings included.
How can you be so incredibly stupid as to not see that?
Gavin Schmidt's graph from Feb. 24, 2016, shows the observed data from all of the sources (NASA, HadCRUT4, etc.) to be well below the CMIP5 mean (the solid black line) that the IPCC used for its predictions.

Ah, but I think you revealed your hand with the "natural forcings included" silliness.

No wonder you haven't provided the source for your graph. Without even knowing the source, we can confidently conclude that it doesn't compare the observed data with the IPCC's actual predictions.

I shoulda known. :biggrin1:

Let's go back to an actual comparison of the observed data and the IPCC's prediction for 2015, using the same baseline.

IPCC prediction: 0.85ºC
Final 2015 anomaly: 0.75ºC.

http://www.bbc.com/news/science-environment-35354579

Fact: 0.75ºC is less than 0.85ºC.

The IPCC's predictions remain consistently and spectacularly wrong.
 

Frankfooter

dangling member
Apr 10, 2015
84,605
19,285
113
Gavin Schmidt's graph shows the observed data from all of the sources (NASA, HadCRUT4, etc.) to be well below the CMIP5 mean (the solid black line) that the IPCC used for its predictions.

Ah, but I think you revealed your hand with the "natural forcings included" silliness.
There are things that can't predicted, like volcanoes, that are 'natural forcings'. Adjusting the projection for those shows the accuracy of the projection itself.
Here's the chart you claim shows the projections are wrong, note that the present temp is right on the dotted line for natural forcing adjusted projections.

It really does show you don't know what you are talking about.


bishop

Banned
Nov 26, 2002
1,800
0
36
And bishop, I have already pointed out that we have show earlier projections to be just as accurate. Here's a chart of an earlier projection, CMIP3, that even has a line showing when the projection was made and how it fared compared to reality.

Then why the fuck do you keep posting CIMP5? If CIMP3 proves your point then post CIMP3, stop posting CIMP5 for f*cks sake.
 
Ashley Madison
Toronto Escorts