CBC report - Most Canadians don't think humans are the main cause of climate change

basketcase

Well-known member
Dec 29, 2005
61,423
6,691
113
I finally had the time to read the Nature article. Unlike some people here (moviefan) I didn't want to run my mouth based solely on the selective reporting in a news story.

A couple comments from the original article:

First off, it is quite clear that movie never read the article or if he did he chose to ignore the majority because he didn't like what it said.

Second, the article completely disagrees with Movie's often stated belief (and I use belief as a pejorative here) that there has been no increase in global temperatures. It states that for a period the global average surface temperature was increasing at a slower rate than the decade before.

Third, the article gives explanations why (instead of movie's claiming "it's natural). One of the major factors they discussed was an unexpected amount of the heat went deep into the Indian Ocean and South West Pacific so it would not be recorded as surface temperature. This super el nino is partly the result of the unusually large amount of deep ocean heat.

Finally( unlike movie) they treat the topic in a scientific way. They use facts to science to try and improve their understanding about the factors that influence climate instead of simply rejecting science because it haven't achieved a perfect understanding yet.
 

Moviefan-2

Court Jester
Oct 17, 2011
10,489
171
63
You are stupid.
Tell us what baseline is used by:
a) HadCRUT4 (where your 0.745ºC number comes from)
b) IPCC projection (where your 0.85ºC comes from)

You can't answer those questions, can you?
Not smart enough, eh?
You don't know what the word "baseline" means. And your statement from yesterday that this had something to do with the bet confirms that you're a total nutjob.

Regardless, I will stand by my conclusion that 0.745ºC is less than 0.85ºC.
 

Moviefan-2

Court Jester
Oct 17, 2011
10,489
171
63
Slowdown in surface warming - its still warming, but at a slightly lower rate.
"Slightly"?

Fyfe says that his calculations show that the planet warmed at 0.170 °C per decade from 1972 to 2001, which is significantly higher than the warming of 0.113 °C per decade he calculates for 2000–14.
http://www.nature.com/news/global-warming-hiatus-debate-flares-up-again-1.19414#/b2

The lead researcher said the per-decade change is "significantly" different, not "slightly."

Learn to read.
 

Moviefan-2

Court Jester
Oct 17, 2011
10,489
171
63
I finally had the time to read the Nature article. Unlike some people here (moviefan) I didn't want to run my mouth based solely on the selective reporting in a news story.

A couple comments from the original article:

First off, it is quite clear that movie never read the article or if he did he chose to ignore the majority because he didn't like what it said.

Second, the article completely disagrees with Movie's often stated belief (and I use belief as a pejorative here) that there has been no increase in global temperatures. It states that for a period the global average surface temperature was increasing at a slower rate than the decade before.

Third, the article gives explanations why (instead of movie's claiming "it's natural). One of the major factors they discussed was an unexpected amount of the heat went deep into the Indian Ocean and South West Pacific so it would not be recorded as surface temperature. This super el nino is partly the result of the unusually large amount of deep ocean heat.

Finally( unlike movie) they treat the topic in a scientific way. They use facts to science to try and improve their understanding about the factors that influence climate instead of simply rejecting science because it haven't achieved a perfect understanding yet.
I always enjoy how Basketcase sets up straw-man arguments by creating imaginary quotes for me. He has learned well from his mentor, Frankfooter.

In fact, what I have said is that the temperature changes that have been reported have not been "statistically significant" and that the Earth's temperature in the 21st century has been stagnant. If you prefer to call that a slowdown, it's fine with me. Tomato, tomahto, whatever.

The paper clearly confirms that the predictions for the 21st century have not been "spectacularly right," as Frankfooter has asserted (with Basketcase also claiming the observed data are within the range of what was predicted).

And then there's the deep ocean explanation. Assuming that explanation is correct (and that is an enormous assumption), that means the predictions of how man-made emissions would affect the climate were spectacularly wrong. The predictions were for surface temperatures, not the deep ocean.

There is a "mismatch" between the predictions and the observed results, as I have been repeatedly telling you for quite some time now.
 

Frankfooter

dangling member
Apr 10, 2015
91,516
22,161
113
You don't know what the word "baseline" means. And your statement from yesterday that this had something to do with the bet confirms that you're a total nutjob.

Regardless, I will stand by my conclusion that 0.745ºC is less than 0.85ºC.
That's twice you were asked a simple question and twice you failed to answer.
Try again.

Tell us what baseline is used by:
a) HadCRUT4 (where your 0.745ºC number comes from)
b) IPCC projection (where your 0.85ºC comes from)

You can't answer those questions, can you?
Just like the article you quoted but didn't read, you don't understand what you are talking about.
And this proves it.
 

Frankfooter

dangling member
Apr 10, 2015
91,516
22,161
113
In fact, what I have said is that the temperature changes that have been reported have not been "statistically significant" and that the Earth's temperature in the 21st century has been stagnant. If you prefer to call that a slowdown, it's fine with me. Tomato, tomahto, whatever.
There was a study that looked at the odds, or the 'statistical significance' of the fact that 15 of the 16 warmest years were 'natural variation', as moviefan likes to claim.
They found that the chance moviefan is correct or that it was natural variation is 0.01%.
http://www.theguardian.com/environm...possible-without-manmade-climate-change-study

Just as moviefan continues to claim that the IPCC projections are 'spectacularly wrong', despite us having bet IPCC projections of a rise to 0.83ºC and the temperatures hitting 0.87ºC.
Another blatantly false claim.

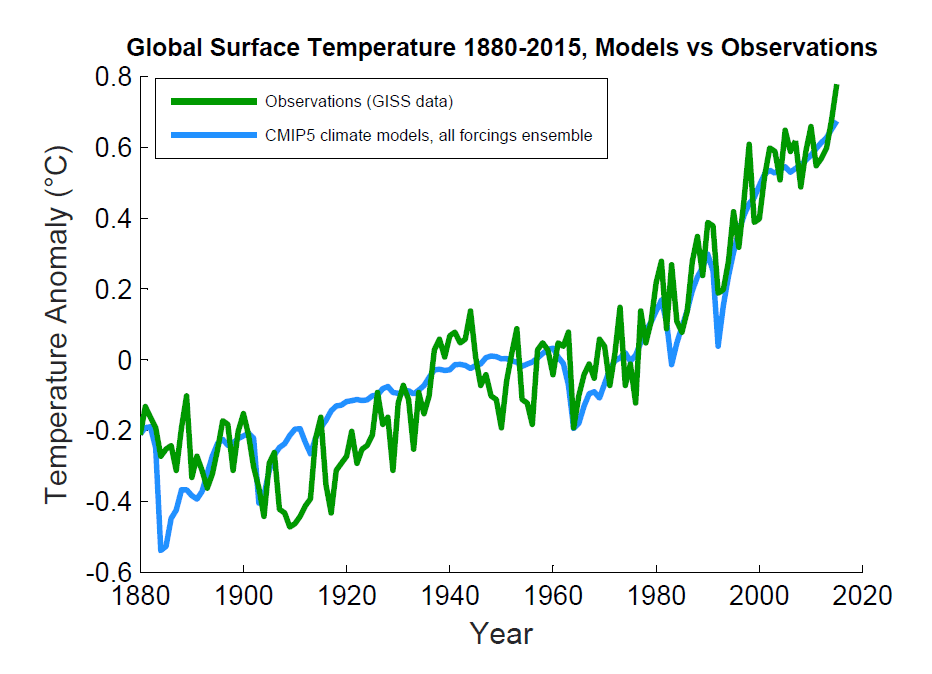
There is no mismatch between projections and reality, for instance here is a chart showing IPCC projections vs reality.
 

basketcase

Well-known member
Dec 29, 2005
61,423
6,691
113
I always enjoy how Basketcase sets up straw-man arguments by creating imaginary quotes for me. He has learned well from his mentor, Frankfooter.....
Sorry but you have endlessly argued that there has been no warming in this century. Are you incapable of remembering what you have posted (actually judging by how much of the Nature article you forgot it is a possibility)?

As for the rest of your crap, the graphs you posted on the IPCC projections actually shows that observed data for almost every year meets the projection. Of course you only used the graph because it ended at 2011, a year that was slightly below and suddenly disavowed it when the data for the last 4 years fits well within it.

Most importantly, you still refuse to discuss science. If you took the time to actually read the articles you would see the authors even comment on how Luddites will ignore the science and instead try to use the report.

And then there's the deep ocean explanation. Assuming that explanation is correct (and that is an enormous assumption), that means the predictions of how man-made emissions would affect the climate were spectacularly wrong. The predictions were for surface temperatures, not the deep ocean.
And embarrassing to your scientific 'credentials' that you post that. It is actually measured that the deep water in the Indian and South-West Pacific was much higher than usual and in case you didn't notice, that heat returned to the surface in the last year making the surface temperature spike.
 

OddSox

Active member
May 3, 2006
3,148
2
36
Ottawa
Most importantly, you still refuse to discuss science.
Sorry, you're so deluded that you don't even know what science is. I'm not even going to argue with you because you obviously won't listen to anything unless it agrees with your religion.
 

Frankfooter

dangling member
Apr 10, 2015
91,516
22,161
113
Sorry, you're so deluded that you don't even know what science is. I'm not even going to argue with you because you obviously won't listen to anything unless it agrees with your religion.
Take a look at the organizations backing the theory of anthropogenic climate change, as listed by NASA:
http://climate.nasa.gov/scientific-consensus/

Tell us which of those are religious organizations, or which ones base their statements on religion.
Then tell us where you find your 'science' that disagrees with all the scientists listed there.

This should be entertaining.
 

Occasionally

Active member
May 22, 2011
2,928
7
38
Climate warming chart torn apart..lol..

Check out this video on YouTube:

http://youtu.be/7ZLqfLZP8Ec


Climate warming chart absoutely torn apart.. This video show how they trick & lied & misled you . You can see what they did to the global warming chart!!


Pat&Stu took this graph from Obama's Science Adviser, Dr. Holdren, and completely blew it to pieces!
Hahaha! What an awesome video.

I don't follow all the global warming stuff, but enjoy how people bicker back and forth on stuff, when the facts they use may be wrong (or misled) to begin with.

Reminds me of this.....

https://en.wikipedia.org/wiki/Dihydrogen_monoxide_hoax

The dihydrogen monoxide hoax involves calling water by the unfamiliar chemical name "dihydrogen monoxide" (DHMO), and listing some of water's effects in an alarming manner, such as the fact that it accelerates corrosion and can cause severe burns. The hoax often calls for dihydrogen monoxide to be regulated, labeled as hazardous, or banned. It illustrates how the lack of scientific literacy and an exaggerated analysis can lead to misplaced fears.[1]

The hoax gained renewed popularity in the late 1990s when a 14-year-old student collected anti-DHMO petitions for a science project about gullibility.[2] The story has since been used in science education to encourage critical thinking, and avoid the appeal to nature.
Also reminds me of people who pay triple the price for something they think is better (almost always has better/fancier packaging) when in fact that "premium" product we make is basically the same thing as the "value" edition, yet some people feel buying the pricier one is better. Well, I guess if it makes them feel more secure then I guess that's all that counts when in fact the actual product quality and functionality is the same... even coming off the same machines. Only difference is that one week makes premium batches, but next week the machines are making the value item.

Mostly comes down to influence and perception.

Just to show how silly packaging really is, notice how commercial grade products, ingredients, supplies offices and restaurants buy come in crappy white or brown boxes with ugly stamped lettering on it? It can be great products, or bargain basement ingredients. But the common trait is generally cheap and ugly looking packaging.

Do business owners looking for high quality supplies or bang for the buck really care if it comes in luxury looking packaging with the coolest fonts or photoshopping? No they don't. So why would you?
 

AK-47

Armed to the tits
Mar 6, 2009
6,697
1
0
In the 6
I want 1,500 pages
 

Frankfooter

dangling member
Apr 10, 2015
91,516
22,161
113
Hahaha! What an awesome video.

I don't follow all the global warming stuff, but enjoy how people bicker back and forth on stuff, when the facts they use may be wrong (or misled) to begin with.
I watched the first minute and a half before I realized what nonsense that is, here's why:
1) Its a chart of mid-tropospheric temperatures - that's mid-atmosphere, while we mostly talk about surface temperatures
2) they accuse those who wrote the chart of 'cherry picking' the start date of 1978, which is idiotic. That data comes from satellite data that wasn't available before 1978, and its known to be less reliable then surface temperature.
3) he says the chart starts and ends near the same temperature, that is what is called 'cherry picking', and it ignores the averages of the chart that clearly show warming, and it also requires even more cherry picking because the real start and of the chart would also show warming.


Why is it that such basic flawed claims fool people?
 

Moviefan-2

Court Jester
Oct 17, 2011
10,489
171
63
Tell us what baseline is used by:
a) HadCRUT4 (where your 0.745ºC number comes from)
b) IPCC projection (where your 0.85ºC comes from)

You can't answer those questions, can you?
Sure I can.

The HadCRUT4 data are anomalies from the mean temperature for the period from 1961 to 1990. The 0.745ºC anomaly for 2015 is publicly available from the Met Office website: https://crudata.uea.ac.uk/cru/data/temperature/HadCRUT4.pdf

Here's the BBC report (which rounded it off to 0.75ºC: http://www.bbc.com/news/science-environment-35354579

The calculation of the comparable IPCC prediction using the same 1961 to 1990 baseline came from Hotwhopper -- in a graph that Frankfooter posted:

And for bonus, here's a chart of projections vs reality, which you still claim are 'spectacularly wrong'.

I stand by my conclusion that 0.745ºC is less than 0.85ºC.
 

Moviefan-2

Court Jester
Oct 17, 2011
10,489
171
63
Hotwhopper said:
I'm not aware of anyone who disputes the fact there was a short term slowdown in surface warming, or the scientific explanations.
http://blog.hotwhopper.com/2016/02/global-surface-warming-continues.html

Hotwhopper, meet Frankfooter and Basketcase.

There is no mismatch between projections and reality....
As for the rest of your crap, the graphs you posted on the IPCC projections actually shows that observed data for almost every year meets the projection.
I suspect what Hotwhopper actually meant is that he's never met anyone who actually knows how to read a graph "who disputes the fact there was a short term slowdown in surface warming."

:biggrin1:
 

Frankfooter

dangling member
Apr 10, 2015
91,516
22,161
113
Sure I can.

The HadCRUT4 data are anomalies from the mean temperature for the period from 1961 to 1990. The 0.745ºC anomaly for 2015 is publicly available from the Met Office website: https://crudata.uea.ac.uk/cru/data/temperature/HadCRUT4.pdf

The calculation of the comparable IPCC prediction using the same 1961 to 1990 baseline came from Hotwhopper -- in a graph that Frankfooter posted:

I stand by my conclusion that 0.745ºC is less than 0.85ºC.
So you took an older chart that was done before the end of 2015 using the year to date data and the 1961 to 1990 MET baseline and compared it to the IPCC projection we made in the bet using NASA's 1951-1980 baseline. Two mistakes in one. First using an older chart that doesn't include the full year's data and second claiming that the 0.85ºC projection is from the same baseline that we've been using.

That chart came from Hotwhopper.com, a blog dedicated to discussing the lies out of wattsupwiththat.com, your favourite site. I'm glad that you accept that as the legit source it is, now you just need to read some of the posts and see if you can defend Watts from any of their claims.

But if you're going to continue to try this claim, lets just use a chart that includes all the data from 2015, not just a 'year to date' chart.
Like this one, from the same source as your chart.


Moviefan-2

Court Jester
Oct 17, 2011
10,489
171
63
So you took an older chart that was done before the end of 2015 using the year to date data and the 1961 to 1990 MET baseline and compared it to the IPCC projection we made in the bet using NASA's 1951-1980 baseline.
No, I didn't. You're mixing and matching things again because you don't know what you're talking about (and you're insane).

I used the final anomaly for 2015 from the Met Office (with all the data), and the numbers had nothing to do with the bet (which was based on an entirely different data set and baseline).

http://www.bbc.com/news/science-environment-35354579

The IPCC prediction came from the Hotwhopper graph, but it's not out of date. The IPCC's prediction hasn't changed since November 2015.

The fact is that 0.75ºC (we'll use the BBC's rounded number) is less than 0.85ºC.

Deal with it.
 

Frankfooter

dangling member
Apr 10, 2015
91,516
22,161
113
No, I didn't. You're mixing and matching things again because you don't know what you're talking about (and you're insane).

I used the final anomaly for 2015 from the Met Office, and the numbers had nothing to do with the bet (which was based on an entirely different data set and baseline).
So you took an older chart and compared it to new data, then took a number from the Met and compared it to a number you read off a chart?

The IPCC prediction came from the Hotwhopper graph
Again, you took an older chart with incomplete data and compared it the complete year data.
Stop using out of date charts, its dishonest.

The projections were quite accurate, as you know from the bet you lost.
Here is a chart that you call 'spectacularly inaccurate'.


Moviefan-2

Court Jester
Oct 17, 2011
10,489
171
63
So you took an older chart and compared it to new data.
Bullshit. You were the one that raised the 0.85ºC prediction on Feb. 24 and wanted to compare it with the final temperature anomaly for 2015. You even accused me of lying.

You don't get to accuse me of lying and then switch to a different data set when you can no longer defend your statement. We'll stick to the data that you insisted on using when you called me a liar.

http://www.bbc.com/news/science-environment-35354579

Using the same baseline:

IPCC prediction: 0.85ºC
Final 2015 anomaly: 0.75ºC.

Fact: 0.75ºC is less than 0.85ºC.

The IPCC's predictions remain consistently and spectacularly wrong.
 

Moviefan-2

Court Jester
Oct 17, 2011
10,489
171
63
Denial 101

Hotwhopper said:
I'm not aware of anyone who disputes the fact there was a short term slowdown in surface warming, or the scientific explanations.
http://blog.hotwhopper.com/2016/02/global-surface-warming-continues.html

Hotwhopper, meet Frankfooter and Basketcase.

There is no mismatch between projections and reality....
The projections were quite accurate...
As for the rest of your crap, the graphs you posted on the IPCC projections actually shows that observed data for almost every year meets the projection.
As I said, I suspect what Hotwhopper actually meant is that he's never met anyone who actually knows how to read a graph "who disputes the fact there was a short term slowdown in surface warming."

:biggrin1:
 

Frankfooter

dangling member
Apr 10, 2015
91,516
22,161
113
Bullshit. You were the one that raised the 0.85ºC prediction on Feb. 24 and wanted to compare it with the final temperature anomaly for 2015. You even accused me of lying.

We'll stick to the data that you insisted on using.

Using the same baseline:

IPCC prediction: 0.85ºC
Final 2015 anomaly: 0.75ºC.

Fact: 0.75ºC is less than 0.85ºC.

The IPCC's predictions remain consistently and spectacularly wrong.
Thank you for confirming that you were using the wrong baselines and mismatching data to make a false claim.
Our projection and data has been based off of NASA's data and baseline, 1951-1980.
http://climate.nasa.gov/vital-signs/global-temperature/
That's where your 0.85ºC number comes from (though we used 0.83ºC, I really don't know why you are trying to change it to 0.85ºC)

And the chart you posted uses the Met Office baseline of 1961-1990.
http://ukclimateprojections.metoffice.gov.uk/23204

Two different baselines.
You don't know what you are talking about.
 
Ashley Madison
Toronto Escorts