Seduction Spa

October Smashes Temperature Records Practically Guaranteeing 2015 Will Be HottestYear

AK-47

Armed to the tits
Mar 6, 2009
6,697
1
0
In the 6
Nonsense. The HadCRUT4 graph that I posted is from Nov. 20, 2015: http://www.cru.uea.ac.uk/cru/data/temperature/

It is the most up-to-date graph available and it shows temperatures in the 21st century were stagnant prior to 2015
The tree rings also showed no significant global warming over last 30 years or so. And you cant argue with tree rings, its Mother Nature's way of leaving a fingerprint behind
 

Frankfooter

dangling member
Apr 10, 2015
91,708
22,202
113
The IPCC's predictions are derived from the average of the CMIP model runs, you twit. Try taking a closer look at the legend in your IPCC graph.
The IPCC projections you are talking about should be referenced by an official IPCC statement.
If you want to talk about the IPCC, you have to use the IPCC statements, otherwise you are bullshitting.

Tell you what, if you give me an official IPCC statement or chart that states that they projected a 0.85ºC global anomaly for 2015 (with the correct baseline, of course), then you can use the hotwhopper chart.
Until then, you are full of shit when you claim that Hotwhopper chart is an IPCC 'prediction' (they make projections, not predictions).
 

Frankfooter

dangling member
Apr 10, 2015
91,708
22,202
113
Nonsense. The HadCRUT4 graph that I posted is from Nov. 20, 2015: http://www.cru.uea.ac.uk/cru/data/temperature/

It is the most up-to-date graph available and it shows temperatures in the 21st century were stagnant prior to 2015.
Its not the most detailed representation of the data.
This Met office chart presents the Hadcrut4 data with more detail, and is also just as up to date.


Moviefan-2

Court Jester
Oct 17, 2011
10,489
171
63
Its not the most detailed representation of the data.
This Met office chart presents the Hadcrut4 data with more detail, and is also just as up to date.

All one has to do is use the link to the actual source:

http://www.cru.uea.ac.uk/cru/data/temperature/

What we see are stagnant global temperatures in the 21st century prior to 2015.

---

By the way, your graph looks an awful lot like a NASA graph, rather than a "Met office chart" with "more detail" on the HadCRUT4 data:


http://data.giss.nasa.gov/gistemp/graphs_v3/

http://www.columbia.edu/~mhs119/Temperature/

Makiko Sato said:
Information in detail with tables and the original data sources are on NASA GISS temperature web pages.
It looks like someone has no issues with mixing and matching different data sets that use completely different baselines. :biggrin1:
 
Last edited:

Moviefan-2

Court Jester
Oct 17, 2011
10,489
171
63
The IPCC projections you are talking about should be referenced by an official IPCC statement.
If you want to talk about the IPCC, you have to use the IPCC statements, otherwise you are bullshitting.
I think it's pretty clear who is bullshitting.

It was you -- not me -- who said the hotwhopper graph shows the "IPCC projection": https://terb.cc/vbulletin/showthrea...-HottestYear&p=5410384&viewfull=1#post5410384. You didn't provide an "official IPCC statement" when you repeatedly posted that graph with the "IPCC projection" -- the one with the "projection" of a 0.85ºC anomaly for 2015. :thumb:

You keep claiming that you're willing to admit to your mistakes (post 300).

So, admit it. You are caught in an obvious lie:

No, but a quick look at the globes temperature and the IPCC's projection should make you look seriously at their claims.
That's not an IPCC projection....
You're not fooling anyone.

The reason you're running away from your own repeatedly posted graph is that you now realize that it confirms the IPCC's "projections" have been spectacularly wrong.
 

Frankfooter

dangling member
Apr 10, 2015
91,708
22,202
113
All one has to do is use the link to the actual source:
Yes, all one has to do is look at the link to the actual source.
http: //www.columbia.edu/~mhs119/Temperature/dTs_60+132mons_v4.gif


By the way, your graph looks an awful lot like a NASA graph, rather than a "Met office chart" with "more detail" on the HadCRUT4 data:
Yes, that's because the measurements from NASA, NOAA and the Met Office all generally agree.
You haven't figured that out yet?
Or are you still confused by all the different baselines?
 

Frankfooter

dangling member
Apr 10, 2015
91,708
22,202
113
I think it's pretty clear who is bullshitting.

It was you -- not me -- who said the hotwhopper graph shows the "IPCC projection": https://terb.cc/vbulletin/showthrea...-HottestYear&p=5410384&viewfull=1#post5410384. You didn't provide an "official IPCC statement" when you repeatedly posted that graph with the "IPCC projection" -- the one with the "projection" of a 0.85ºC anomaly for 2015. :thumb:
I made a mistake with that link, I was looking for a chart that has the most recent temperature readings on it for comparison.
Unfortunately that one seems to use updated CIMP5 numbers, not the IPCC's projections.

But once again, if you want to compare the IPCC's projections, you need to start with the IPCC's projections, not some other chart.
 

Moviefan-2

Court Jester
Oct 17, 2011
10,489
171
63
Unfortunately that one seems to use updated CIMP5 numbers, not the IPCC's projections.
This is a new one --now, you're confessing to a "mistake" that isn't a mistake. :biggrin1:

The IPCC's predictions are based on the ensemble mean (or average, in layman's terms) of the CMIP (Coupled Model Intercomparison Project) runs, as was explained in Chapter 9 of the IPCC's AR5 report (http://www.ipcc.ch/pdf/assessment-report/ar5/wg1/WG1AR5_Chapter09_FINAL.pdf). The graph you posted has accurately captured the average of the CMIP5 run, which represents IPCC's "projections." Your initial posting was correct.

And those "projections" continue to be spectacularly wrong.

Your "mistake" was thinking the IPCC's "projections" bear any resemblance to reality.
 

Moviefan-2

Court Jester
Oct 17, 2011
10,489
171
63
Yes, that's because the measurements from NASA, NOAA and the Met Office all generally agree.
You haven't figured that out yet?
Or are you still confused by all the different baselines?
Nonsense. NASA and the Met Office use entirely different baselines and record entirely different numbers.

And, frankly, even if you thought they were similar, it wouldn't change the fact that you were caught telling a blatant lie.

This Met office chart presents the Hadcrut4 data with more detail, and is also just as up to date.
Makiko Sato said:
Information in detail with tables and the original data sources are on NASA GISS temperature web pages.
http://www.columbia.edu/~mhs119/Temperature/

This is the most recent HadCRUR4 graph: http://www.cru.uea.ac.uk/cru/data/temperature/HadCRUT4.pdf

And it clearly shows that temperatures in the 21st century were stagnant prior to 2015.
 

K Douglas

Half Man Half Amazing
Jan 5, 2005
27,289
7,953
113
Room 112
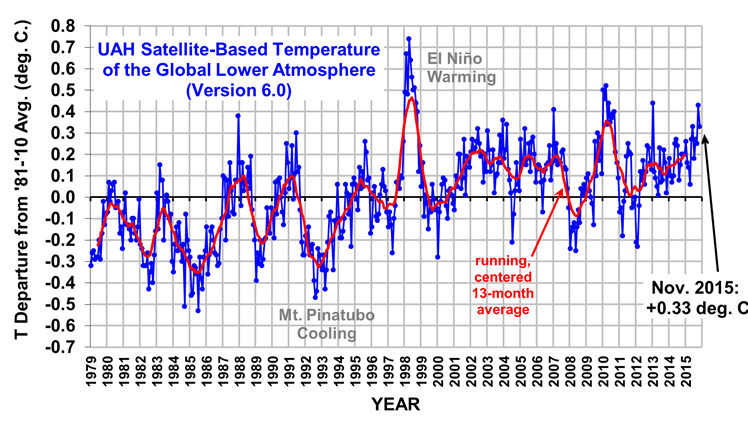
The only graph you need. No adjustments to data. Empirical results.
 

Frankfooter

dangling member
Apr 10, 2015
91,708
22,202
113
This is a new one --now, you're confessing to a "mistake" that isn't a mistake. :biggrin1:

The IPCC's predictions are based on the ensemble mean (or average, in layman's terms) of the CMIP (Coupled Model Intercomparison Project) runs, as was explained in Chapter 9 of the IPCC's AR5 report (http://www.ipcc.ch/pdf/assessment-report/ar5/wg1/WG1AR5_Chapter09_FINAL.pdf). The graph you posted has accurately captured the average of the CMIP5 run, which represents IPCC's "projections." Your initial posting was correct.
Hey, you were the one who said you shouldn't mix data sets.
So if you want to talk about IPCC projections, use the published IPCC projections.
All else is conjecture.

By the way, now that our bet is within 0.005ºC of me winning, and proving that the IPCC projections are accurate, don't you feel just a little bit foolish when you keep claiming they aren't accurate?
 

Frankfooter

dangling member
Apr 10, 2015
91,708
22,202
113
Nonsense. NASA and the Met Office use entirely different baselines and record entirely different numbers.
.
I have no idea why you don't understand this, but its not a big deal to adjust for different baselines.
The IPCC did it in the legit chart, just check the 'observations'.


AK-47

Armed to the tits
Mar 6, 2009
6,697
1
0
In the 6
The only graph you need. No adjustments to data. Empirical results.
That graph does show a slight warming trend. Although I dont think its statistically significant
 

Moviefan-2

Court Jester
Oct 17, 2011
10,489
171
63
So if you want to talk about IPCC projections, use the published IPCC projections.
I did. The published sources -- including your source -- has the IPCC "projection" for 2015 at 0.85ºC and the HadCRUT4 anomaly (using the same baseline) in this super El Nino year at just 0.71ºC.

Proving the IPCC's "projections" have been spectacularly wrong.
 
Last edited:

Moviefan-2

Court Jester
Oct 17, 2011
10,489
171
63
I have no idea why you don't understand this, but its not a big deal to adjust for different baselines.
The IPCC did it in the legit chart, just check the 'observations'.
You were caught telling a blatant lie.

This Met office chart presents the Hadcrut4 data with more detail, and is also just as up to date.
Makiko Sato said:
Information in detail with tables and the original data sources are on NASA GISS temperature web pages.
The graph you posted did not come from the Met Office and it did not "present" HadCRUT4 data.

http://www.columbia.edu/~mhs119/Temperature/

You were lying. There's no debate on that point.
 

Frankfooter

dangling member
Apr 10, 2015
91,708
22,202
113
I did. The published sources -- including your source -- has the IPCC "projection" for 2015 at 0.85ºC and the HadCRUT4 anomaly (using the same baseline) in this super El Nino year at just 0.71ºC.

Proving the IPCC's "projections" have been spectacularly wrong.
No, you are spectacularly wrong.
Post your link to your IPCC statement projectioning 0.85ºC for 2015.
 

Moviefan-2

Court Jester
Oct 17, 2011
10,489
171
63
No, you are spectacularly wrong.
Post your link to your IPCC statement projectioning 0.85ºC for 2015.
"Projectioning"?

Only Frankfooter thinks that others should be required to produce the data to support the graph that he posted.

No matter. It is easy to prove that the IPCC uses the average of the model runs for its "projections".

CMIP is the Coupled Model Intercomparison Project that is used by the IPCC to measure changes in the climate. The most recent version, CMIP5, is the version that was being used by the IPCC when it issued its AR5 report in 2013.

http://cmip-pcmdi.llnl.gov/

http://cmip-pcmdi.llnl.gov/cmip5/index.html

The IPCC confirmed this on Page 769 of Chapter 9 of its AR5 report, in its comparison of observed temperatures and CMIP5 simulations: "Box 9.2 Figure 1a; CMIP5 ensemble mean trend is 0.21ºC per decade" (http://www.ipcc.ch/pdf/assessment-report/ar5/wg1/WG1AR5_Chapter09_FINAL.pdf).

It is also confirmed on Page 19 of the Summary for Policymakers that the IPCC's projections are now based on scenarios that were created using CMIP5: http://www.climatechange2013.org/images/report/WG1AR5_SPM_FINAL.pdf.

The Hotwhopper.com web page that Franky pulled his graph from confirms that the line for CMIP5 is the "multi-model mean" -- the average of the current model runs: http://blog.hotwhopper.com/2015/11/lesson-1126-in-how-to-be-science.html

What is the CMIP5 average for 2015? According to both hotwhopper.com and the National Post, the average (using a comparable baseline with the HadCRUT4 data) for 2015 is about 0.85ºC.

- Hotwhopper.com (2015): http://1.bp.blogspot.com/-rRPfFl2DQ...an+surface+temperature+hadcrut4+and+model.png

- National Post (2014): https://financialpostbusiness.files.wordpress.com/2014/06/fe0617_climate_c_mf.jpeg?w=620&h=552

As the IPCC has confirmed, its projections come from the average of the CMIP runs. The IPCC is currently using CMIP5 and the CMIP5 mean temperature projection for 2015 is 0.85ºC. The current HadCRUT4 anomaly of 0.71ºC is nowhere near the 0.85ºC "projection."

The IPCC's "projections" continue to be spectacularly wrong.
 
Last edited:

Moviefan-2

Court Jester
Oct 17, 2011
10,489
171
63
Meanwhile, we're still waiting for Frankfooter to acknowledge that he was blatantly lying about the HadCRUT4 data.

This Met office chart presents the Hadcrut4 data with more detail, and is also just as up to date.
Makiko Sato said:
Information in detail with tables and the original data sources are on NASA GISS temperature web pages.
Frankfooter's graph you posted did not come from the Met Office and it did not "present" HadCRUT4 data.

http://www.columbia.edu/~mhs119/Temperature/

Frankfooter is a compulsive liar.
 
Ashley Madison
Toronto Escorts