President Is Dead Wrong About Climate Change: Nobel Prize Winning Scientist

PornAddict

Active member
Aug 30, 2009
3,620
2
36
60
Home / 2015 / August / 07 / Cooling Atlantic Trend: Iceland Sees Coldest Summer in More Than 20 Years… “Cold Period Taking Over”

http://notrickszone.com/2015/08/07/...od-taking-over/#sthash.OwktoZNS.BsWLd3QU.dpbs

Cooling Atlantic Trend: Iceland Sees Coldest Summer in More Than 20 Years… “Cold Period Taking Over”
By P Gosselin on 7. August 2015
The Iceland Monitor website here writes the North Alantic island is having its coldest summer in more than 20 years. According to the site:

The first thirteen weeks of summer this year have been the coldest in Reykjavik in over twenty years, reveals Icelandic meteorologist Trausti Jónsson.

The northern city of Akureyri fares even worse – one has to go back around thirty years to find a colder summer.”

Experts now say their are growing signs that this may be much more than a mere weather anomaly, and have more to do with an overall developing cooling trend. The Iceland Review site here writes that Met Office meteorologist Páll Bergþórsson warns how “Iceland may be entering a cold period“:

Iceland has enjoyed 25 years of above-average temperatures, Páll told Morgunblaðið, but those years may be over with a cold period taking over in the coming years.

‘The ocean here off Southwest Iceland is colder than usual and the cold is persistent after it first arrives,’ Páll stated.”

The cold is not isolated to Iceland, but appears to be spreading across the greater North Atlantic. Paul Homewood writes at his site on how the United Kingdom recently “saw one of the coldest July nights for many years“, with southern England setting a new record low of just 1°C on August 1st.

The cold gripping the North Atlantic likely is likely in large part due to cooling sea surface temperatures. The following chart from Climate4You shows how SST in June was at its lowest point in 14 years.

- See more at: http://notrickszone.com/2015/08/07/...od-taking-over/#sthash.OwktoZNS.BsWLd3QU.dpuf
 

Moviefan-2

Court Jester
Oct 17, 2011
10,489
172
63
Unless you have anything real to back up this claim, you should just stop repeating it.
You mean other than the historical record?: http://a-sceptical-mind.com/wp-content/uploads/2010/01/Comparison-charts.jpg

Furthermore, the adjusted results for 2014 are inconsistent with most surface temperature results for that year (HadCRUT, Berkeley Earth Sciences, the Japan Meteorological Agency) and the satellite results for 2014.

Scientists on both sides of the debate have questioned the methodology used and the NOAA has failed to address the criticisms. Until that happens, the evidence-based conclusion that the numbers are inflated will stand.
 

PornAddict

Active member
Aug 30, 2009
3,620
2
36
60
Your links are no good, on two different levels.
1) The first one doesn't work, the second one dishonestly tries to pass of 'lower atmosphere' temps as if they were surface temperatures, which is what we are talking about here.
2) both come from denier sites that don't provide sources for the data. Note that I am linking to direct sources, such as NASA and NOAA, which include all documentation. Its one of the ways you can tell its legit and not total bullshit.

Once again, this is a chart from NASA.
Its current and its legit.
I assume that you are also horizontally challenged and think this shows a flat line?

You ARE THE one is guilable looking at Climate model of graph that is manipulated.
Frankfooter you never repondED to my previous post 398.

I am waiting for you counter arguements or rebuttal on my post.


PROOF MY ARGUEMENT IS WRONG FRANKFOOTER IF YOU CAN!!


Here the main three reasons why all global warming model is inaccurate and unreliable! This is a facts that you cannot OR ANYONE / and especially you or any climate scientists can dispute at all !

HERE A BET/ CHALLENGE IF YOU CAN PROOF / DISPUTE ALL THIS FOUR MAIN POINTS....

IF YOU CAN DISPUTE THIS ALL FOUR MAIN POINTS BELOW I PROMISE I WILL STAND NAKED IN FRONT TIME SQUARE OR DUNDAS SQUARE OR DOWNTOWN TORONTO IN FRONT OF CITY TV STATION OR ANYPLACE OF YOUR CHOOSING WEARING A SIGN SAYING " GLOBAL WARMING IS REAL!!! OR ANY THING YOU LIKE ME TO WRITE ON THE SIGN .


FRANKFOOOTER ......YOU CANNOT ABLE TO PROOF ME WRONG ON THOSE 4 MAIN POINTS .. I CHALLENGED ALL GLOBAL WARMIST ALARMIST TO DISPROVED BY MAIN POINTS LISTED BELOW. IF YOU CAN PROVE ME WRONG I WILL STAND NAKED IN FRONT OF NY TIME SQUARE OR DUNDAS SQUARE OR DOWNTOWN TORONTO.


The ONLY place that CO2 causes global warming is in the computer models..

SEE IF YOU CAN DISPUTE OR PROVE ALL THESE 4 Main POINTS I LISTED BELOW!!.

HERE ARE THE FOUR MAIN POINTS why CLIMATE MODELS ARE UNRELIABLE:

CLIMATE Computer models that don't include these factors:

1) CHAOS( HAVE NOT BEEN MODEL)
2) ENSO ( El Nino-Southern Osillation) ..." ENSO" CANT BE MODELED)
3) or clouds (because they haven't been able to model clouds yet),
4) or the oceanic decadal oscillations (as admitted by the IPCC).


Climate is not linear, it is chaotic and chaos has not yet been successfully modeled. Climate computer models are an attempt to predict chaos with a linear mathematical model that doesn't include three!!! of greatest influences on climate. Gee, what could go wrong?

This three greatest influences on climate are ENESO,CLOUDS, and oceanic decadal oscillations!


Hence that why all climate models are UNRELIABLE, NOT ACCURATE AND IT IS CRAP !!!

Anyone that have a brain know there is no way on earth you can model a Cloud !!!!


PS Believe what you want Frankfooter, " This is what You offered is your personal opinion, which is worth nothing. :!!!

PPS FRANKFOOTERS. OR ANY TERBITES WHO IS GLOBAL WARMER BELIEVERS .... PROVE ME WRONG IF YOU CAN !! PROVIDE ME LINKS AND DATA AND CONCRETE EVIDENCES ON THAT THE COMPUTER MODELS ON THIS CLOUDS, ENESO, OCEANIC DECADALS OSCILLATIONS SHOWING ME THAT THEY ARE ABLE TO MODEL THAT IN THEIR CLIMATE MODEL
I was waiting for ANYONE THAT CAN rebuttal on this post to prove me wrong
 

Frankfooter

dangling member
Apr 10, 2015
91,967
22,316
113
How the Global Warming Scare Began

https://www.youtube.com/watch?v=SyUDGfCNC-k

he comments section of this video perfectly illustrates how ass-backwards today's faux intellectuals are. John Coleman took the time to produce a 36-minute video to objectively explain his position,and never once resorting to name-calling, only to be called all sorts of names by those who disagree with him. Even more insulting is the way they demand that he prove his credentials to them despite having both a degree and a 50-year career in meteorology, while the career politician who took one science class in college is somehow considered a credible authority on any scientific matter at all. If John Coleman's experience and expertise don't even matter to these people, then nothing ever will. Of course, if he believed in the theory of man-made global warming, they'd call him a wise old sage, but because he doesn't, they just call him a senile old relic instead. It's a blatant double standard, and it's anti-intellectual to boot.
John Coleman?
The man who said this:
Coleman "claimed that average global temperatures had risen by 'maybe a tenth of a degree' over the last century; strange then that the IPCC (Intergovernmental Panel on Climate Change) reported in 2007 that temperatures actually increased by an average of 0.74°C over the same period." [4]
http://www.desmogblog.com/john-coleman

Do you think that claim is correct?
If he could be so incredibly wrong on such a basic fact, why would you trust anything else he says?
He is after all, not a scientist or even a meteorologist.
 

Frankfooter

dangling member
Apr 10, 2015
91,967
22,316
113
That has nothing to do with NASA, and your claim that 'That the NOAA data have been grossly inflated is not seriously disputed.'
Again, you have provided only your opinion.

Prove that NASA has 'cooked the books' or stop claiming this total nonsense.
Yes, let's all pretend that we're surprised that the grossly inflated fairy-tale numbers that NOAA (and now NASA) are using keep producing "warmest month ever" claims.

Furthermore, NASA's own numbers showed that prior to the cooking of the books, there wasn't a single month from January to May of 2015 that was a record breaker.
 

PornAddict

Active member
Aug 30, 2009
3,620
2
36
60
That has nothing to do with NASA, and your claim that 'That the NOAA data have been grossly inflated is not seriously disputed.'
Again, you have provided only your opinion.

Prove that NASA has 'cooked the books' or stop claiming this total nonsense.
http://www.cfact.org/2015/02/19/record-keepers-cooked-global-temperature-books/
Record keepers cooked global temperature books

Remember the horror stories about 2014 being the hottest year since before Henry Ford took his date to the prom in a hay-fueled buggy?

The terrors posed by melting glaciers and rising sea levels threatening polar bears and Al Gore’s new coastal California residence? And oh yeah, mustn’t forget those historic first-time-ever droughts and tag team hurricanes — all caused, of course, by our CO2-belching smoke stacks and SUVs?

Well, maybe not. It seems that official surface temperature records upon which this panic has rested have been systematically cooked to indicate that Earth has recently been overheating just as alarmists, including some at NASA, wish us to believe. This will come as no surprise, however, to scientists familiar with data recorded from satellite and high altitude balloon instruments. That data shows that global mean temperatures have been statistically flat over the past 18 years.

Pseudoscientific chicanery reported last year by Steven Goddard’s Real Science blog illustrates shameless manipulation of some of the world’s most influential climate records.

His investigation reveals that many surface measurements originally recorded in NOAA’s U.S. Historical Climatology Network (USHCN) have been replaced with temperatures “fabricated” from theoretical computer models.

In doing so, original recorded temperatures were subsequently lowered, thereby exaggerating warming in recent decades by comparison. Whereas the original records dustbowlingshow that the U.S. has actually been cooling since the 1930s, the hottest decade on record, NOAA’s manipulated graph based nearly half on fantasy data projects a high warming rate in excess of 3º C per century.

ASA’s Goddard Institute for Space Studies based its recent mainstream media-parroted “2014 hottest year” canard on this same contrived data, but ratcheted up the hot spin cycle even more.

Yet when the Daily Mail asked the new NASA-GISS Director Gavin Schmidt why the press release failed to mention his own low confidence that the likelihood of 2014 being “the warmest year since 1880” is just 38%, he offered no response.

Incidentally, that alleged “record” amounted to a two-hundredths of a degree increase over 2010, the previously claimed “warmest year.” That miniscule difference falls within a margin of error broadly recognized to be several times higher.

More evidence of this feverish fraud was reported earlier this month by English journalist Christopher Booker in The Telegraph. Booker’s U.K. article discussed an investigation into “how we are being tricked by flawed data on global warming,” which was conducted by Paul Homewood who checked original temperature graphs for weather stations in Paraguay against subsequent substitutions.

paraguayBooker noted that “the actual trend over 60 years of data had been dramatically reversed, so that a cooling trend was changed to one showing a marked warming.”
Homewood then checked a swath of other South American weather stations around the original three, finding the same one-way “adjustments” in all of them.


The first of these again appeared in NOAA’s USHCN. These in turn, were then amplified by NASA-GISS and NOAA’s National Climate Data Center using hypothetical warming trends to estimate temperatures across vast regions of the planet where no measurements exist.

Yet, as Booker emphasizes, “these are the very records on which scientists and politicians rely for their belief in ‘global warming’.”

Homewood is now finding evidence of the same pattern of data fudging for weather stations across much of the Arctic between Canada and the heart of Siberia.
In nearly every case the one-way tweaks show warming up to 1º C higher than actual original data indicate. Replaced versions also completely eliminate obvious evidence of Iceland’s “sea ice years” around 1970, when extreme cooling nearly devastated the country’s economy.

Homewood points out that even a 1987 NASA-GISS graph presented in a paper authored by its former director and lead climate alarmist James Hansen was doctored siberiandogsto “transform Arctic history.”


This falsification was first exposed in 2007 by Canadian statistician Steve McIntyre. Here, the original Arctic temperatures which were actually much higher than any time since had been lowered so much that they became dwarfed by those of the past 20 years.

Those who worry a lot about the vanishing Arctic ice caps and drowning polar bears we keep hearing about in order to sell the Obama Administration’s EPA war on coal should be cheered to know that Arctic temperature shifts have virtually nothing at all to do with atmospheric CO2 concentrations. In reality they are caused by perfectly natural multi-decadal changes in Atlantic Ocean currents.

So now that the Atlantic is about to flip back to a cyclical cooling phase, perhaps we should begin to worry more about how to heat our homes with windmills and sunbeams. In any case, will someone please kindly inform Al Gore and those frantic polar bears they can finally relax?

NOTE: A version of this article appears at http://www.Newsmax.com/LarryBell/climate-global-warming-gore-co2/2015/02/16/id/624956/#ixzz3SCr7yo6n

- See more at: http://www.cfact.org/2015/02/19/record-keepers-cooked-global-temperature-books/#sthash.eag4Wnil.dpuf
 

Frankfooter

dangling member
Apr 10, 2015
91,967
22,316
113
I'll hold you to that.
And this is the latest chart from the source, agreed?


And, as they noted on their site, NASA's numbers and methodology generally agree with NOAA, agreed?
And, according to the source of our bet, 2014 was the warmest year on record, agreed?

From the NASA site:
The 10 warmest years in the 134-year record all have occurred since 2000, with the exception of 1998. The year 2014 ranks as the warmest on record. (Source: NASA/GISS). This research is broadly consistent with similar constructions prepared by the Climatic Research Unit and the National Oceanic and Atmospheric Administration.
http://climate.nasa.gov/vital-signs/global-temperature/
 

Frankfooter

dangling member
Apr 10, 2015
91,967
22,316
113
I am waiting for you counter arguements or rebuttal on my post.

PROOF MY ARGUEMENT IS WRONG FRANKFOOTER IF YOU CAN!!
I am waiting for cogent arguments from someone who can at least spell argument.
I am waiting for legit data to back up these claims, not just all caps and blue font.

But just for you, tell me why these points don't answer your claims/points/blue words.
1) What is the difference between modelling fractals and chaos? What is the difference between random number generation and chaos, and why can you not model chaos? Provide the specific papers and concerns for each of these claims.
2)
The consensus of ENSO prediction models indicate continuation of strong El Niño conditions during the August-October 2015 season in progress. Some further strengthening into fall is likely, with the event lasting into spring 2016.
http://iri.columbia.edu/our-expertise/climate/forecasts/enso/current/
Provide a detailed analysis of why this is not modelling or predicting ENSO, including historical predictions with accuracy and modelling of other currents.
3) How much effect on decade or century predictions do you expect aerosols to have? Give me a figure, or find it here:
https://www.ipcc.ch/pdf/assessment-report/ar5/wg1/WG1AR5_Chapter07_FINAL.pdf
Provide detailed claims, complete with what data you are basing this claim from and the papers in which it is referenced.
4) Why do you think their answers aren't included here:
https://www.ipcc.ch/pdf/assessment-...d/WGIAR5_WGI-12Doc2b_FinalDraft_Chapter14.pdf
Post the specific details of your claims, and why those aren't more questions of 'weather' vs 'climate change'. Provide data to back up your claim.
Tell us what information they include and what you else you think is missing.


How different is this from being able to predict that fall will be colder then normal, without prediction daily temperatures? How much minute and/or daily shifts to you think have to be predicted before predicting the changes that are likely in a decade?

And in order for you to show that you aren't just copying these blue points from somewhere else, use your own words to show us that you fully understand the subject.
 

basketcase

Well-known member
Dec 29, 2005
61,661
6,776
113
Yes, let's all pretend that we're surprised that the grossly inflated fairy-tale numbers that NOAA (and now NASA) are using keep producing "warmest month ever" claims.
...
If your only defense is some kind of scientific conspiracy, you might wonder if your opinion actually has any merit.
 

basketcase

Well-known member
Dec 29, 2005
61,661
6,776
113

Moviefan-2

Court Jester
Oct 17, 2011
10,489
172
63
If your only defense is some kind of scientific conspiracy, you might wonder if your opinion actually has any merit.
LOL. You seem to think anyone who doesn't live in a world of complete gullibility is a "conspiracy theorist."

Scientists on both sides of the debate (eg., the Met Office in the U.K.) have questioned the "adjustments" and the assumptions behind them. And it is a confirmed fact that the "adjusted" numbers are at total odds with the surface and satellite data gathered throughout the rest of the world.

Furthermore, the NOAA has failed to address any of the concerns raised.

Draw the obvious conclusion.

Speaking of the rest of the world, your repeated claim that updated data for 2014 would prove there has been warming appears to have gone bust.

Not only do my graphs (both surface and satellite data) show that's wrong, but your own graph from the Japan Meteorological Agency shows 2014 was in line with the temperatures in 2005 and 2010 -- and all three years were reportedly a tad cooler than 1998.
 

PornAddict

Active member
Aug 30, 2009
3,620
2
36
60
North Pole could be ice free in 2008
https://www.newscientist.com/articl...-2008/?DCMP=ILC-hmts&nsref=news5_head_dn13779

New Scientist is one of the most reputable peer review journal. So it now 2015 the ice in north pole must be ice free now. We are in the summer month.
The Global alarmist climite scientist which they claim it 92% they are right and the debate is over. Someone should google the north pole and tell me if there are any ice in the North Pole.

PS HOW ACCURATE ARE THOSE NASA / CLIMATE ALARMIST FAMOUS COMPUTER CLIMATE MODEL??? NOT ACCURATE OR RELIABLE AT ALL ..CLIMATE COMPUTERS MODELS ARE ALL CRAP.. GARBAGE IN AND GARBAGE OUT!!!! Climate is not linear, it is chaotic and chaos has not yet been successfully modeled. Climate computer models are an attempt to predict chaos with a linear mathematical model that doesn't include three!!! of greatest influences on climate. Gee, what could go wrong?

This three greatest influences on climate are ENESO,CLOUDS, and oceanic decadal oscillations!


Hence that why all climate models are UNRELIABLE, NOT ACCURATE AND IT IS CRAP !!!
 

PornAddict

Active member
Aug 30, 2009
3,620
2
36
60
If you need to be taught the difference between weather and climate, you're in the wrong thread.
Home / 2015 / August / 07 / Cooling Atlantic Trend: Iceland Sees Coldest Summer in More Than 20 Years… “Cold Period Taking Over”

http://notrickszone.com/2015/08/07/c....BsWLd3QU.dpbs

Cooling Atlantic Trend: Iceland Sees Coldest Summer in More Than 20 Years… “Cold Period Taking Over”
By P Gosselin on 7. August 2015
The Iceland Monitor website here writes the North Alantic island is having its coldest summer in more than 20 years. According to the site:

The first thirteen weeks of summer this year have been the coldest in Reykjavik in over twenty years, reveals Icelandic meteorologist Trausti Jónsson.

The northern city of Akureyri fares even worse – one has to go back around thirty years to find a colder summer.”

Experts now say their are growing signs that this may be much more than a mere weather anomaly, and have more to do with an overall developing cooling trend. The Iceland Review site here writes that Met Office meteorologist Páll Bergþórsson warns how “Iceland may be entering a cold period“:

Iceland has enjoyed 25 years of above-average temperatures, Páll told Morgunblaðið, but those years may be over with a cold period taking over in the coming years.

‘The ocean here off Southwest Iceland is colder than usual and the cold is persistent after it first arrives,’ Páll stated.”

The cold is not isolated to Iceland, but appears to be spreading across the greater North Atlantic. Paul Homewood writes at his site on how the United Kingdom recently “saw one of the coldest July nights for many years“, with southern England setting a new record low of just 1°C on August 1st.

The cold gripping the North Atlantic likely is likely in large part due to cooling sea surface temperatures. The following chart from Climate4You shows how SST in June was at its lowest point in 14 years.

- See more at: http://notrickszone.com/2015/08/07/c....BsWLd3QU.dpuf
 

Frankfooter

dangling member
Apr 10, 2015
91,967
22,316
113
LOL. You seem to think anyone who doesn't live in a world of complete gullibility is a "conspiracy theorist."
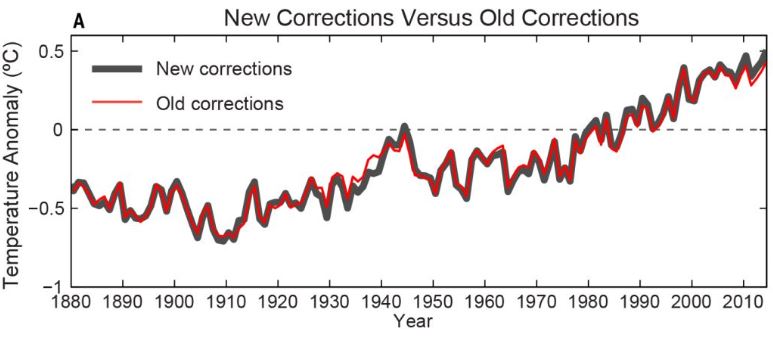
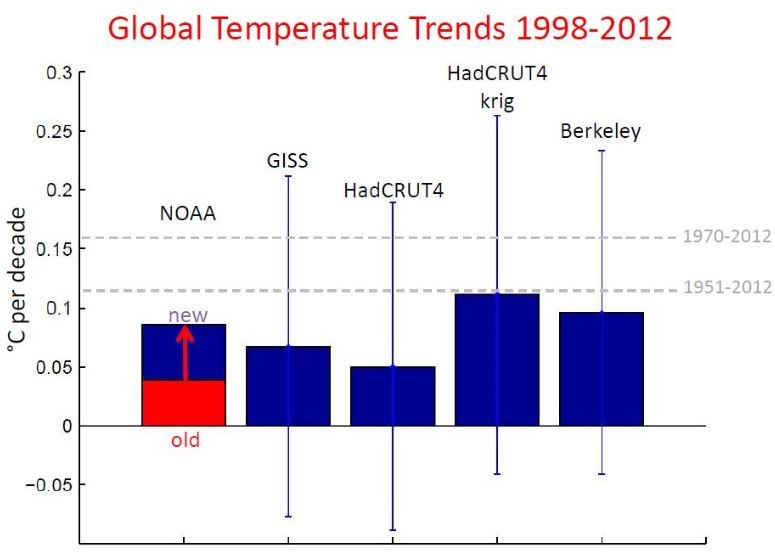
Here are charts showing the differences between adjusted and non-adjusted readings.


Both of these come from an excellent post explaining the updates.
http://www.realclimate.org/index.php/archives/2015/06/debate-in-the-noise/

For those who can read charts, all this shows is the changes are minor and bring the NOAA readings more in line with other readings.
Calling this 'cooking the books' without any evidence is an accusation of fraud that is totally baseless.
 

Frankfooter

dangling member
Apr 10, 2015
91,967
22,316
113
This three greatest influences on climate are ENESO,CLOUDS, and oceanic decadal oscillations!

Hence that why all climate models are UNRELIABLE, NOT ACCURATE AND IT IS CRAP !!!
Its a bit ridiculous for you to keep claiming this when its patently obvious you don't understand the issues.
Go back and answer my questions about your claims, and if you can't, do some reading until you can.
Until then, you really shouldn't shout out claims about things you don't understand.
 

red

you must be fk'n kid'g me
Nov 13, 2001
17,572
8
38
25 pages of going back and forth. Ever think of agreeing to disagree?
 
Ashley Madison
Toronto Escorts