Toronto Escorts

October Smashes Temperature Records Practically Guaranteeing 2015 Will Be HottestYear

Frankfooter

dangling member
Apr 10, 2015
83,961
19,073
113
To be fair to Basketcase, we should remember that Frankfooter also doesn't know how to read a graph.

In September, the HadCRUT4 data showed the temperature anomaly for 2015 to be 0.68°C. It has increased slightly since then to 0.71°C.

And yet, Franky reported the following....

Sept. 5, 2015 -- He said the HadCRUT4 temperature anomaly for 2015 was 0.809°C: https://terb.cc/vbulletin/showthrea...ng-Scientist&p=5339893&viewfull=1#post5339893

Nov. 29, 2015 -- He said the HadCRUT4 temperature anomaly for 2015 was 0.79°C: https://terb.cc/vbulletin/showthrea...imate-Change&p=5411834&viewfull=1#post5411834

Franky has no idea what he's talking about.
Wrong again, moviefan.
You're on a roll.

You are committing the very sin you accuse others of.
The point I have been making is Basketcase was mixing and matching numbers from different data sets (without any adjustments) to create a fairy-tale depiction of warming.
You are comparing posts that have the following differences:
a) dates - March vs a post in November
b) different data sets - One references Hadcrut 4 and the other Hadcrut 4.4.0
First post links to:
http://www.metoffice.gov.uk/hadobs/...time_series/HadCRUT.4.4.0.0.annual_ns_avg.txt
Second post refers to this post:
https://terb.cc/vbulletin/showthrea...imate-Change&p=5411584&viewfull=1#post5411584
links to:
http://www.cru.uea.ac.uk/cru/data/temperature/HadCRUT4-gl.dat

According to your terms, you have no idea what you are talking about.
 

Frankfooter

dangling member
Apr 10, 2015
83,961
19,073
113
According to the oft posted IPCC graphs,...we should be setting new high temp. records ever day.

Its rather obvious that there is a pause in the so called global warming,...which is preceding the next little ice age.

FAST
Do you mean like this?
Climate change makes past five-year period the warmest on record: WMO

...
Extreme weather events such as heatwaves can now be attributed to anthropogenic climate change with greater confidence, Jarraud said.

Last summer, 2,500 people died in India during a heatwave blamed on climate change, while Pakistan recorded another 2,000 fatalities as temperatures soared as high as 49C.

“There were significant, record heatwaves in many parts of the world [in 2015],” Jarraud said. “Can we attribute these extreme weather events to climate change? When it comes to temperature, the answer is increasingly yes for some of the big ones.”

Research indicated that the probability of such sweltering conditions had risen by a factor of up to 10 because of climate change, he added.

China experienced its warmest ever year on record in 2015 in the period to October, while the continent of Africa is currently undergoing its second warmest.

Other increasingly severe weather events such as floods, droughts and tropical storms were developing in line with the WMO’s expectations, based on climate models.
http://www.theguardian.com/environm...st-five-year-period-the-warmest-on-record-wmo
 

FAST

Banned
Mar 12, 2004
10,069
1
0
Well that's some web sites opinion.

1910 was the warmest on record also,...so whats your point ?

I see you are still avoiding the re-writing history,...sorry,...re-calibrating graph question.

To remind you,...just what the hell does it depict,...an increase in past temp. data,...or simply nothing,...useless.

If it doesn't communicate information...why post it in the 1st place?

FAST
 

Frankfooter

dangling member
Apr 10, 2015
83,961
19,073
113
Well that's some web sites opinion.

FAST
Some web site?
You really can't judge sources can you?

First, its posted on the Guardian, a legit and respectable source.
Second, it refers to a report by the WMO, the World Meteorological Organization.
That report is linked in the article and is right here:

https://www.wmo.int/media/content/w...est-record-2011-2015-warmest-five-year-period


But what else can I expect from you?
To remind you,...just what the hell does it depict,...an increase in past temp. data,...or simply nothing,...useless.
I've explained that graph to you in detail, gave you the original article and am going to have to give up you.
You just don't seem smart enough to understand that graph.

So to summarize, you can't tell the difference between a report by the WMO and 'some website', and you still can't read a chart, even when its explained to you.
Why the fuck do you think you are smart enough to be able to tell whether the science and research on global warming is legit?
 

AK-47

Armed to the tits
Mar 6, 2009
6,697
1
0
In the 6
Sorry Franky, I'm not buying the whole global warming thingie anymore. I've been through too many of these end-of-the-world phenomena.

In the 80's it was acid rain, Russian nukes, Arctic ice-age......etc... .etc.

I'm gonna pour myself a sweet whiskey on the rocks, fire up a nice Cuban cigar, sit back and lets see what happens
 
Last edited:

AK-47

Armed to the tits
Mar 6, 2009
6,697
1
0
In the 6
According to the oft posted IPCC graphs,...we should be setting new high temp. records ever day.

Its rather obvious that there is a pause in the so called global warming,...which is preceding the next little ice age.

FAST
And you know what, part of Climategate was they couldnt explain that earth was supposed to get warmer ever year, yet the treerings over last 20 years didnt suppport the data at all, it showed a stagnation period..

Tree rings are virtually perfect, because you cant hide what nature has on record
 

Frankfooter

dangling member
Apr 10, 2015
83,961
19,073
113
And you know what, part of Climategate was they couldnt explain that earth was supposed to get warmer ever year, yet the treerings over last 20 years didnt suppport the data at all, it showed a stagnation period..

Tree rings are virtually perfect, because you cant hide what nature has on record
Oh god, here we go again.
Just to show how out of touch you are, I'll give you yet another reminder.
Climate change makes past five-year period the warmest on record: WMO
http://www.theguardian.com/environm...st-five-year-period-the-warmest-on-record-wmo

(note, this was posted in #243, just up the page. To claim that we should be setting records and ignore the global annual records is idiotic, just as its idiotic to post a claim that we should be setting records four posts after the records were posted)


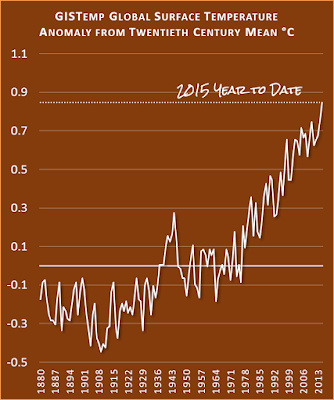
And a chart, I know you have a tough time with them, but look at this chart and tell me that it isn't a chart that depicts upward movement.
 

K Douglas

Half Man Half Amazing
Jan 5, 2005
26,529
6,940
113
Room 112
The problem is you.
You are just unaware.

This graph proves one thing - that the 30's were the hottest decade in North America as many of the skeptics such as Dr Don Easterbrook have cited. It also shows that, at least in Toronto anyway, our climate has become more moderate since the 30's-50's.
 

Frankfooter

dangling member
Apr 10, 2015
83,961
19,073
113
This graph proves one thing - that the 30's were the hottest decade in North America as many of the skeptics such as Dr Don Easterbrook have cited. It also shows that, at least in Toronto anyway, our climate has become more moderate since the 30's-50's.
Its hard to find charts for Toronto's yearly temperatures, but I did find this one, doesn't go back to the 30's, but still shows a steady increase.
http://www.xylenepower.com/Temperature Data.htm
 

Moviefan-2

Court Jester
Oct 17, 2011
10,489
171
63
You are comparing posts that have the following differences:
a) dates - March vs a post in November
b) different data sets - One references Hadcrut 4 and the other Hadcrut 4.4.0
Um ... is there anyone else on TERB who thinks the ninth month of the year is "March"? :biggrin1:

https://terb.cc/vbulletin/showthrea...ng-Scientist&p=5339893&viewfull=1#post5339893

Furthermore, you will see that his "March" post did cite the HadCRUT 4.4.0 data.

His response from last night confirms my point.

For the record, the HadCRUT data never had the 2015 anomaly at 0.79°C or 0.809°C. The fact that Frankfooter would try to defend those claims proves that he still can't read a graph.
 

Frankfooter

dangling member
Apr 10, 2015
83,961
19,073
113
In any event, his response confirms my point.

For the record, the HadCRUT data never had the 2015 anomaly at 0.79°C or 0.809°C. The fact that Frankfooter would try to defend those claims proves that he still can't read a graph.
Nonsense, data gets updated.
That was the data at the time.

Why are values slightly different when I download an updated file a year later?

All the files on this page (except Absolute) will be updated on a monthly basis to include the latest month within about four weeks of its completion. Updating includes not just data for the last month but the addition of any late reports for up to approximately the last two years. Every year, we will also add in updated data for stations that do not report in real time using station we will be accessing from National Meteorological Services (NMSs) around the world. This addition will take place around the second month of the year, as by then sufficient NMSs will have made their monthly average data available for the preceding year. Where available, we will add in extra data from some NMSs when they make more homogeneous data available. The routine annual updates will include data from the USA, Canada, Russia, Australia and a number of European countries.
In addition to this the method of variance adjustment (used for CRUTEM3v, CRUTEM4v and HadCRUT3v) works on the anomalous temperatures relative to the underlying trend on an approximate 30-year timescale. Estimating this trend requires estimation of grid-box temperatures for years before the start of each record and after the end. With the addition of subsequent years, the underlying trend will alter slightly, changing the variance-adjusted values. Effects will be greatest on the last year of the record, but an influence can be evident for the last three to four years. Full details of the variance adjustment procedure are given in Jones et al.
http://www.cru.uea.ac.uk/cru/data/temperature/#faq10
 

Moviefan-2

Court Jester
Oct 17, 2011
10,489
171
63
That was the data at the time.
Bullshit.

Data get updated but HadCRUT never had the temperature anomaly for 2015 anywhere near the numbers Frankfooter cited.

Indeed, the 0.79°C claim was only posted this past Sunday (https://terb.cc/vbulletin/showthrea...imate-Change&p=5411834&viewfull=1#post5411834). There hasn't been a change to the data since then, and the actual anomaly for 2015 is currently 0.71°C -- not 0.79°C.

Franky admitted as much that same day, after I corrected him: https://terb.cc/vbulletin/showthrea...imate-Change&p=5411862&viewfull=1#post5411862.

Indeed, there was only a 13-minute difference between Franky's original post and the post where I corrected him. It is impossible to believe that HadCRUT radically adjusted its data within that 13-minute period.

(And I still haven't heard how he determined that the ninth month of the year is "March" :biggrin1:)
 

Frankfooter

dangling member
Apr 10, 2015
83,961
19,073
113
Indeed, the 0.79°C claim was only posted this past Sunday (https://terb.cc/vbulletin/showthrea...imate-Change&p=5411834&viewfull=1#post5411834). There hasn't been a change to the data since then, and the actual anomaly for 2015 is currently 0.71°C -- not 0.79°C.

Franky admitted as much that same day, after I corrected him: https://terb.cc/vbulletin/showthrea...imate-Change&p=5411862&viewfull=1#post5411862.
Hadcrut 4.4.0 - 0.805ºC
http://www.metoffice.gov.uk/hadobs/...time_series/HadCRUT.4.4.0.0.annual_ns_avg.txt
Hadcrut 4 - 0.713ºC
http://www.cru.uea.ac.uk/cru/data/temperature/HadCRUT4-gl.dat

Go to town now, check those numbers.

You still haven't admitted you've been lying and trying to pass of fake IPCC charts as legit.
https://terb.cc/vbulletin/showthrea...-HottestYear&p=5413419&viewfull=1#post5413419

I may have made a few mistakes, which I've admitted, but I've never tried to pass of fake info as legit like you have, multiple times.
 

Moviefan-2

Court Jester
Oct 17, 2011
10,489
171
63
LMFAO!

In your "Hadcrut 4.4.0" table, try taking a look at the number for 2015 in the left-hand column of the table.

Why, lo and behold, it's 0.713 -- the exact same number for 2015 as the anomaly for the year in your "HadCRUT 4" table.

Next, take a look at the numbers in the left-hand column of the "Hadcrut 4.4.0" table for 2014, 2013, 2012, etc., etc ... they're also the exact same as the reported anomalies for each year in the "HadCRUT4" table.

In your first link, you were reading the wrong column. It's the column on the left that gives you the anomaly for the year.

And both 0.713 figures for 2015 are the same as what is reported on the graph: http://www.cru.uea.ac.uk/cru/data/temperature/HadCRUT4.pdf

You don't know how to read a graph and you don't know how to read tables. Or maybe you just think it's a coincidence that the left column in one table and the right-hand column in the other are the exact same. :biggrin1:
 
Last edited:

FAST

Banned
Mar 12, 2004
10,069
1
0
Some web site?
You really can't judge sources can you?

First, its posted on the Guardian, a legit and respectable source.
Second, it refers to a report by the WMO, the World Meteorological Organization.
That report is linked in the article and is right here:

https://www.wmo.int/media/content/w...est-record-2011-2015-warmest-five-year-period


But what else can I expect from you?

I've explained that graph to you in detail, gave you the original article and am going to have to give up you.
You just don't seem smart enough to understand that graph.

So to summarize, you can't tell the difference between a report by the WMO and 'some website', and you still can't read a chart, even when its explained to you.
Why the fuck do you think you are smart enough to be able to tell whether the science and research on global warming is legit?
All the same regurgitated BULL SHIT from the SAME sources,...repeated over and over again,...still BULL SHIT.

As far as,..."explained that graph to you in detail",...you did no such thing,...for one simple reason,...it depicts NOTHING.
BUT the real reason you won't won't provide any "detail" is,...because the re-writing of history,...sorry,..re-calibrating,...accomplished exactly what it set out to do,...

Modify the PAST original temps data to insure the UNEMPLOYABLEs clubs predictions looked correct.

Try again,...

FAST
 

basketcase

Well-known member
Dec 29, 2005
60,312
6,463
113
Sure. Except Basketcase didn't make those adjustments -- he simply plotted the different data sets on the same graph and then drew preposterous conclusions about the temperature anomalies in 2013 and 2014.
....
Wow you get more and more pathetic.

You chose the IPCC(ish) graph as a valid source. You chose the hadcrut data as a valid source. Now that it is 100% clear that the hadcrut data you posted fits withing the IPCC projections you posted all you have is avoidance and insults.
 
Ashley Madison
Toronto Escorts