Toronto Escorts

Climate Change

Frankfooter

dangling member
Apr 10, 2015
82,365
18,401
113
building up cities that radiate and trap heat around the thermometers used to track temperatures have a lot to do with it

Milton, Vaughan, Mississauga , Markham, Whitby , Oakville , Pickering would all have been in the green in the 1960s

View attachment 321798
Included in a report 17 years ago.
Did you check?

No.

Why?
Because you can't do basic research, don't understand the science and can't read and understand the IPCC reports.
 

JohnLarue

Well-known member
Jan 19, 2005
16,681
2,377
113
A reminder of the basics.
The planet is warming as much as projected by the IPCC as we put more CO2 into the atmosphere.
Nobody is denying this is happening.


the IPCC models can not replicate the past, a bare minimum for any predictive model

here are the models vs. satellite data and weather balloon data

look at the errors of the models vs historical actuals
1714881382473.png

there is not even agreement amongst the models
go figure: they all are driven by co2 concentration


there is defiantly something wrong with the physics fundamentals being coded into the models
that happens when you try to model a pre-determined conclusion rather than trying to gain a deeper understanding how our decoupled non-linear chaotic climate system functions

hint: cloud cover varies and varies a lot
1714881806400.png

1714881882365.png


1714881856186.png

1714881924044.png
 

Frankfooter

dangling member
Apr 10, 2015
82,365
18,401
113
the IPCC models can not replicate the past, a bare minimum for any predictive model

here are the models vs. satellite data and weather balloon data

look at the errors of the models vs historical actuals
View attachment 322144

there is not even agreement amongst the models
go figure: they all are driven by co2 concentration


there is defiantly something wrong with the physics fundamentals being coded into the models
that happens when you try to model a pre-determined conclusion rather than trying to gain a deeper understanding how our decoupled non-linear chaotic climate system functions

hint: cloud cover varies and varies a lot
Bait and switch, larue.
What is wrong with you?

The IPCC measurements and projections are for surface temps you dishonestly, or ignorantly, tried to sneak in a chart of temps in the troposphere.
Do you even understand why that is stupid?
 

JohnLarue

Well-known member
Jan 19, 2005
16,681
2,377
113
Bait and switch, larue.
What is wrong with you?
the performance of the models vs. verified satellite And weather balloon data is not a bait and switch
it is experimental data vs. flawed models

you climate alarmists always blow a fuse when confronted with reality

The IPCC measurements and projections are for surface temps you dishonestly, or ignorantly, tried to sneak in a chart of temps in the troposphere.
Do you even understand why that is stupid?
too funny
the troposphere is where the AGW theory predicts the warming will occur
you do not understand what you babble about

the surface temp records are a mess and have been diddled with
1714887408401.png


Michael Mann is not credible
that happens when you commit scientific fraud

there is defiantly something wrong with the physics fundamentals being coded into the models
that happens when you try to model a pre-determined conclusion rather than trying to gain a deeper understanding how our decoupled non-linear chaotic climate system functions
 

JohnLarue

Well-known member
Jan 19, 2005
16,681
2,377
113
A reminder of the basics.
The planet is warming as much as projected by the IPCC as we put more CO2 into the atmosphere.
Nobody is denying this is happening.

it looks like your favourite country Norway is quite skeptical and thus denying your propaganda

a national institution : Statistics Norway
kind of tough for you to perform your go-to character assassination on a national institution


ttps://www.ssb.no/en/natur-og-miljo/forurensning-og-klima/artikler/to-what-extent-are-temperature-levels-changing-due-to-greenhouse-gas-emissions/_/attachment/inline/5a3f4a9b-3bc3-4988-9579-9fea82944264:f63064594b9225f9d7dc458b0b70a646baec3339/DP1007.pdf
Statistisk sentralbyra
Statistics Norway

To what extent are temperature levels changing due to greenhouse gas emissions?
Using theoretical arguments and statistical tests we find, as in Dagsvik et al. (2020), that the effect of man-made CO2 emissions does not appear to be strong enough to cause systematic changes in the temperature fluctuations during the last 200 years.
Temperature reconstructions indicate that there is a ‘warming’ trend that seems to have been going on for as long as approximately 400 years. Prior to the last 250 years or so, such a trend could only be due to natural causes.
One way to distinguish the effect of man-made emissions of greenhouse gases on temperatures from the effect of natural causes, is to check if temperature variations can be explained using GCMs. For this to be possible, a minimum requirement must be that GCMs are able to reproduce historically observed temperatures.
it turns out that temperature, as a temporal process, appears to have cycles that can last for decades (long memory), if not hundreds of years. It is for precisely this reason that even such a prolonged increase in recent observed temperature series should not simply be interpreted as a trend leading to permanent climate change.
the analyses of Beenstock et al. (2016), and McKitrick and Christy (2020) are startling and raise serious doubts about the quality of the GCMs, and in particular, if the CO2 sensitivity has been correctly identified.
In an IPCC review it was claimed that “There continues to be very high confidence that the models reproduce observed large-scale mean surface temperature patterns (pattern correlation ∼0.99)” (IPCC, 2014, p. 743)16 .
The statement by IPCC cited above is therefore misleading.
In this paper we have reviewed data on climate and temperatures in the past and ascertained that there have been large (non-stationary) temperature fluctuations resulting from natural causes. Subsequently, we have summarized recent work on statistical analyses on the ability of the GCMs to track historical temperature data. These studies have demonstrated that the time series of the difference between the global temperature and the corresponding hindcast from the GCMs is non-stationary. Thus, these studies raise serious doubts about whether the GCMs are able to distinguish natural variations in temperatures from variations caused by man-made emissions of CO2. Next, we have updated the statistical time series analysis of Dagsvik et al. (2020) based on observed temperature series recorded during the last 200 years and further back in time. Despite long trends and cycles in these temperature series, we have found that the hypothesis of stationarity was not rejected, apart from a few cases. These results are therefore consistent with the results obtained by Dagsvik et al. (2020). In other words, the results imply that the effect of man-made CO2 emissions does not appear to be sufficiently strong to cause systematic changes in the pattern of the temperature fluctuations. In other words, our analysis indicates that with the current level of knowledge, it seems impossible to determine how much of the temperature increase is due to emissions of CO2.
 

Frankfooter

dangling member
Apr 10, 2015
82,365
18,401
113
the performance of the models vs. verified satellite And weather balloon data is not a bait and switch
it is experimental data vs. flawed models
No, larue, you are using bait and switch.
You are intentionally using troposphere temperatures instead of surface temperatures.
You're even using only old satellite data and the most recent data.
There is a reason your charts end in 2001, satellite data was corrected to fix orbital issues and agrees much more with surface temps.

Your use of bait and switch and 20 year old charts is a total failure, larue.
Its the cheapest and stupidest fake arguments.

What is wrong with you?
 

Frankfooter

dangling member
Apr 10, 2015
82,365
18,401
113
it looks like your favourite country Norway is quite skeptical and thus denying your propaganda

a national institution : Statistics Norway
kind of tough for you to perform your go-to character assassination on a national institution


ttps://www.ssb.no/en/natur-og-miljo/forurensning-og-klima/artikler/to-what-extent-are-temperature-levels-changing-due-to-greenhouse-gas-emissions/_/attachment/inline/5a3f4a9b-3bc3-4988-9579-9fea82944264:f63064594b9225f9d7dc458b0b70a646baec3339/DP1007.pdf
Statistisk sentralbyra
Statistics Norway
Larue, prove you read and understand that paper by telling us in your own words what 'non-stationary temperature fluctuations' means.
 

JohnLarue

Well-known member
Jan 19, 2005
16,681
2,377
113
No, larue, you are using bait and switch.
You are intentionally using troposphere temperatures instead of surface temperatures.
You're even using only old satellite data and the most recent data.
There is a reason your charts end in 2001, satellite data was corrected to fix orbital issues and agrees much more with surface temps.

Your use of bait and switch and 20 year old charts is a total failure, larue.
Its the cheapest and stupidest fake arguments.

What is wrong with you?

you are just not bright enough to figure out that the two satellite data sets match the 4 independent weather balloon data sets
independent data sets matching is a confirmation of their accuracy

meanwhile 73 computer model projections vary wildly from the actual measured values and vary wildly from each other
despite claims of a 'settled science' understanding

if the modelling bozos really had a 'settled science' understanding then all of the model projections would have fallen unto the same curve with little variance
(like the satellite and weather balloon data did)
that's how science works

there is defiantly something wrong with the physics fundamentals being coded into the models
that happens when you try to model a pre-determined conclusion rather than trying to gain a deeper understanding how our decoupled non-linear chaotic climate system functions


surface temp records are a mess
look at the mess they make when used as data inputs
and they have been diddled with

1714915721748.png
 

JohnLarue

Well-known member
Jan 19, 2005
16,681
2,377
113
Larue, prove you read and understand that paper by telling us in your own words what 'non-stationary temperature fluctuations' means.
sure, just as soon as you tell us in your own words what the following means

Using theoretical arguments and statistical tests we find, as in Dagsvik et al. (2020), that the effect of man-made CO2 emissions does not appear to be strong enough to cause systematic changes in the temperature fluctuations during the last 200 years.
Temperature reconstructions indicate that there is a ‘warming’ trend that seems to have been going on for as long as approximately 400 years. Prior to the last 250 years or so, such a trend could only be due to natural causes.
 
Apr 12, 2017
107
139
43
The planet has warmed well over 1.5°C in a century in the past. We can speculate what caused it but we don't know for sure because we weren't there to experience it.
I would say that population explosion in the 20th century and building up cities that radiate and trap heat have a lot to do with it. Would make sense no? I'd say that's a far more plausible explanation than putting an extra 140 ppm CO2 in the atmosphere.
Definitely human impact in last for climate change in last 100 years.

The actual temperature change is debatable. Climate change policies are also debatable.
 

Frankfooter

dangling member
Apr 10, 2015
82,365
18,401
113
you are just not bright enough to figure out that the two satellite data sets match the 4 independent weather balloon data sets
independent data sets matching is a confirmation of their accuracy
larue, cut it out.

You're lying and you're lying very poorly.
The IPCC projections and temperature measurements are clearly SURFACE temps, not those taken by weather balloons in the troposphere.
This is not about temperatures in the clouds, its about surface temperatures.

Note that the IPCC projections are mapped against Global Surface Warming.


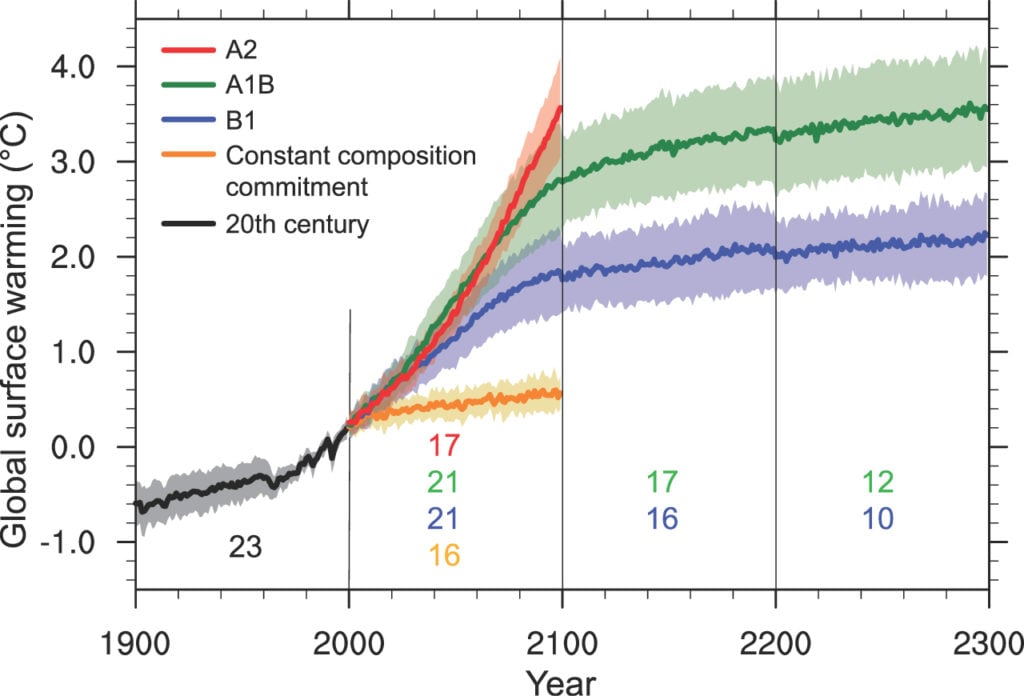
Then compare that to NASA global temperature measurements.

This graph shows the change in global surface temperature compared to the long-term average from 1951 to 1980. Earth’s average surface temperature in 2023 was the warmest on record since recordkeeping began in 1880 (source: NASA/GISS). NASA’s analysis generally matches independent analyses prepared by the National Oceanic and Atmospheric Administration (NOAA) and other research groups. Overall, Earth was about 2.45 degrees Fahrenheit (or about 1.36 degrees Celsius) warmer in 2023 than in the late 19th-century (1850-1900) preindustrial average. The 10 most recent years are the warmest on record.

The animation on the right shows the change in global surface temperatures. Dark blue shows areas cooler than average. Dark red shows areas warmer than average. Short-term variations are smoothed out using a 5-year running average to make trends more visible in this map.
 

JohnLarue

Well-known member
Jan 19, 2005
16,681
2,377
113
Definitely human impact in last for climate change in last 100 years.
there is no definitive experimentally verified evidence that separates anthropogenetic impacts from natural variability.
you can go pour a gallon of water into lake Ontario and you will be adding incrementally to the lake volume, but you can not measure the change in the water level
The atmosphere is enormous and atmospheric plant food is measured in parts per million
the all important 15 micron absorption wavelength is saturated

1714917315917.gif
climate changes, always has , always will

The actual temperature change is debatable.
yes it is

Climate change policies are also debatable.
Climate change policies are beyond stupid

1714917467515.jpeg
 

Frankfooter

dangling member
Apr 10, 2015
82,365
18,401
113
there is no definitive experimentally verified evidence that separates anthropogenetic impacts from natural variability.
You are lying again, larue.
I've posted this study every time you've made this claim and each time you ignore and move on to some other stupid claim.

This NASA study confirmed that solar energy balance has changed due to the increase in greenhouse gases in the atmosphere.
In Brief:
A NASA study has confirmed with direct evidence that human activities are changing Earth's energy budget, trapping much more energy from the Sun than is escaping back into space.


JohnLarue

Well-known member
Jan 19, 2005
16,681
2,377
113
You are lying again, larue.
I've posted this study every time you've made this claim and each time you ignore and move on to some other stupid claim.

This NASA study confirmed that solar energy balance has changed due to the increase in greenhouse gases in the atmosphere.
In Brief:
A NASA study has confirmed with direct evidence that human activities are changing Earth's energy budget, trapping much more energy from the Sun than is escaping back into space.


NASA Goddard should have hired a head scientist who is willing to debate / defend their conclusions in a public form
Gavin Schmidt destroyed NASA Goddard scientific credibility.
theories that can not stand up to the rigours of debate are just propaganda


Schmidt's flawed models results are somewhere in this mess

1714919041072.png
 
Last edited:

JohnLarue

Well-known member
Jan 19, 2005
16,681
2,377
113
larue, look at the NASA study I posted.
It answers your challenge about experimental proof.
what part of
NASA Goddard should have hired a head scientist who is willing to debate / defend their conclusions in a public form
Gavin Schmidt destroyed NASA Goddard scientific credibility.
theories that can not stand up to the rigours of debate are just propaganda
did you not understand ?

Statistics Norway is not running away from debate

ttps://www.ssb.no/en/natur-og-miljo/forurensning-og-klima/artikler/to-what-extent-are-temperature-levels-changing-due-to-greenhouse-gas-emissions/_/attachment/inline/5a3f4a9b-3bc3-4988-9579-9fea82944264:f63064594b9225f9d7dc458b0b70a646baec3339/DP1007.pdf
Statistisk sentralbyra
Statistics Norway

To what extent are temperature levels changing due to greenhouse gas emissions?
Using theoretical arguments and statistical tests we find, as in Dagsvik et al. (2020), that the effect of man-made CO2 emissions does not appear to be strong enough to cause systematic changes in the temperature fluctuations during the last 200 years.
Temperature reconstructions indicate that there is a ‘warming’ trend that seems to have been going on for as long as approximately 400 years. Prior to the last 250 years or so, such a trend could only be due to natural causes.
 

Frankfooter

dangling member
Apr 10, 2015
82,365
18,401
113
what part of

did you not understand ?

Statistics Norway is not running away from debate

ttps://www.ssb.no/en/natur-og-miljo/forurensning-og-klima/artikler/to-what-extent-are-temperature-levels-changing-due-to-greenhouse-gas-emissions/_/attachment/inline/5a3f4a9b-3bc3-4988-9579-9fea82944264:f63064594b9225f9d7dc458b0b70a646baec3339/DP1007.pdf
Statistisk sentralbyra
Statistics Norway
Gavin Schmidt is the head of NASA's GISS program, why should he have to publicly debate anti science trolls?
If there are contrary theories and evidence present them with your research in a paper.

You keep posting that Norway study but you can't even explain what its central premise is about.
You clearly cannot understand the subject.

You used bait and switch troposphere charts instead of using surface temperatures.
You then declared there is no experimental evidence and ran away when I presented it.

Now you are down to character assassination on the head of NASA's GISS program.
What is wrong with you?
 
Ashley Madison
Toronto Escorts