Ashley Madison

Climate Change

Frankfooter

dangling member
Apr 10, 2015
94,243
23,690
113
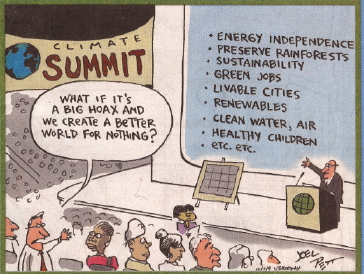
Bullshit. Even if CO2 was the driver, if China and India aren't going to reduce emissions, anything we do is pointless. It won't affect squat. Except collapse modern western civilization.
How is moving to cheaper renewables and heat pumps going to 'collapse western civilization'?
That's more likely to happen with crop failure and extreme weather disasters, if anything.


canada-man

Well-known member
Jun 16, 2007
32,191
2,707
113
Toronto, Ontario
canadianmale.wordpress.com
How Activist Scientists Enforce Climate Misinformation Through Bullying And Other Tactics


This post is inspired by the successful efforts last week of climate activists — including three widely-cited scientists — to enforce misinformation by the legacy media.

In a nutshell, ABC News wrote an accurate story about how the climate was not a major or even significant factor in the Lahaina, Maui, fire and disaster. [emphasis, links added]


After being mobbed by the enforcers, the story was changed to emphasize the role of climate.

These sorts of activist scientists
who seek to enforce preferred public narratives have been called the “science police.”

Today’s post pushes back against this narrative enforcement with some actual science.

Have a look at the panel below. It shows three versions of a climate time series for annual counts of North Atlantic major hurricanes from 1995 to 2050. Two of the graphs include a large change in climate, but one of them does not.


Please take a moment to consider which of the three panels you think includes climate change, which does not, and why you came to that judgment.


Here’s the answer.

  • The top panel takes annual counts of major hurricanes in the North Atlantic to create a probability distribution based on actual data from 1945 to 2022. For 2023 to 2050, the annual counts are randomly selected from this distribution.
  • For the middle panel, I took this probability distribution based on observations and shifted it — starting instantaneously in 2023 — one count to the right (so, for example, the probability of having 3 major hurricanes becomes the probability of having 4, and so on). This large shift is much larger than changes in counts projected for 2100, but this is just an exercise.
  • The bottom panel shows a time series based on a shift of 2 counts to the right, representing a much larger change in probabilities.
You can see the three probability distributions in the figure below, with colors to match the panel above. This sort of figure has become common in climate discussions, and you can see an example at the top of this post.


Let me suggest two important lessons from this exercise.

First, neither of the climate change series in the top panel comes anywhere close to meeting the IPCC criteria for the detection of climate change.

But wait a second there! We know that in the time series, the climate has in fact changed —
because I changed it — as shown in the shifted probabilities.

So, what gives?

It is not just possible, but often likely, that for specific climate variables, the underlying climate changes, and yet the consequences of those changes are not detectable in short (climatically speaking) time series.

I chose the period 1995 to 2050 because over that time frame my kids will enter their 50s, and be about my age today. It’s the same as me looking at a time series from the 1960s to today. In practice, a lot of climate research on detection and attribution uses much shorter time series.

It is standard today for climate advocates to link every extreme weather event and disaster to climate change.

My suspicion is that when they do so they are not actually saying anything about the detection or attribution of changes but rather, they are simply witnessing the reality of climate change and its deep importance to them.

Part of this witnessing may be to preemptively defend against concerns that if climate changes are not perceived to be large enough, people won’t have enough fear — no one wants to be accused of minimizing climate change.

Lesson: Just because the signal of climate change for particular variables cannot (yet) be detected in the context of historical variability does not mean that climate change is not real or important, and in many if not most cases a lack of signal is to be expected.

In fact, that is exactly what the IPCC concludes with respect to most extreme weather events, as shown in the table below and discussed here.

The white cells show where signal detection is not expected to be unequivocally achieved at present, by 2050, or by 2100 (respectively in the three right-most columns).


Advocates who promote every extreme event as being caused by, linked to, made worse by, or fueled by climate change are promoting misinformation in almost all cases.

It is an expression of faith, not science. This complicates public discussions of detection and attribution.

Some people are expressing a deeply held religious-like sentiment, and others are talking about data and evidence.

No wonder people talk past each other.

Second, you’ll note in the top figure in the panel above — the one with the black linear trend line — that there is a large decrease in major hurricane activity in the North Atlantic from 1965 to 2050. There were about four per year at the start of the time series and only two at the end, a drop of 50%.

That decrease is real in the sense that there are fewer major hurricanes toward the end of this record as compared to the beginning, but it has nothing to do with a change in the climate, as the annual probabilities do not change over the entire data range.

Compare the figure below, which shows the entire dataset from which the top figure in the panel above was taken. The below figure shows 1945 to 2080 and you can see an increase of 50% from the start to the end — but this trend also is not the result of a change in climate, as the annual probabilities are constant.


So, what gives?

Many climate variables exhibit large variability — since 1945 we’ve observed anywhere from 0 to 7 major hurricanes yearly in the North Atlantic, that’s a huge variation.

The three probability distributions graphed above represent annual counts of major hurricanes of 2.6 based on observations (black), and about 3.6 (red) and 4.6 (green) in the two shifted probabilities.

The shifted probabilities represent increases in major hurricane annual counts of ~40% and ~80% — much larger than almost all model projections assessed by Knutson et al. for 2100 (and many actually project a decrease).

Many projected changes in the behavior of extreme events due to climate change are in fact small in the context of historical variability.

That is just a fact — have another look at the IPCC table above.

Further, historical variability is sufficiently large that we can look at various time series and fool ourselves into thinking we see change when all we are observing is cherry-picked variability (see the two-time series above with the black linear trends).

Lesson: Natural variability is real and significant. It does not mean that climate change is not real or important, but that detecting signals is often difficult even when climate is changing and there is always a risk of erroneously detecting signals where none is present.

There is a good reason that climate change has been detected and attributed by the IPCC for temperature and precipitation at large spatial scales — this is where we have the most measurements and through aggregation, variability becomes smaller, making it easier to separate signal from noise.

Consider that there are millions of measurements of temperature and precipitation around the world, but there were only 78 major hurricanes in the North Atlantic from 1945 to 2022 — numbers matter!

But even for temperature, at local levels detection and attribution are challenging, as climate scientists Ed Hawkins explains (emphasis added):

The signal of temperature change varies spatially, as does the size and timing of the natural fluctuations of temperature. Together, these two aspects combine to produce the local experience of how the climate is changing. For the public, this is critical – it is extremely difficult to detect trends over decadal timescales for individual locations, especially in regions of high variability . . .
The challenges of detection and attribution should tell us that both adaptation and mitigation policies must be built upon a foundation that involves justifications for action that are much broader than climate change alone.

So far, climate advocates have sought to shape perceptions of science to support a climate-change-is-everything agenda. We will have a lot more success if we instead shape policy to align with what science actually says.

Roger Pielke Jr. has been a professor at the University of Colorado since 2001. Previously, he was a staff scientist in the Environmental and Societal Impacts Group of the National Center for Atmospheric Research. He has degrees in mathematics, public policy, and political science, and is the author of numerous books. (Amazon).

Read the full post at The Honest Broker

How Activist Scientists Enforce Climate Misinformation Through Bullying And Other Tactics - Climate Change Dispatch
 

Frankfooter

dangling member
Apr 10, 2015
94,243
23,690
113
the nazi germany linked eugenics supporting traitors at the Rockefeller foundation(authors of operation lockstep which was used for covid lockdowns and restrictions) backed a climate change lawsuit in Montana
You sound like a kook.
 

Frankfooter

dangling member
Apr 10, 2015
94,243
23,690
113
How Activist Scientists Enforce Climate Misinformation Through Bullying And Other Tactics


This post is inspired by the successful efforts last week of climate activists — including three widely-cited scientists — to enforce misinformation by the legacy media.

In a nutshell, ABC News wrote an accurate story about how the climate was not a major or even significant factor in the Lahaina, Maui, fire and disaster. [emphasis, links added]


After being mobbed by the enforcers, the story was changed to emphasize the role of climate.

These sorts of activist scientists
who seek to enforce preferred public narratives have been called the “science police.”

Today’s post pushes back against this narrative enforcement with some actual science.

Have a look at the panel below. It shows three versions of a climate time series for annual counts of North Atlantic major hurricanes from 1995 to 2050. Two of the graphs include a large change in climate, but one of them does not.


Please take a moment to consider which of the three panels you think includes climate change, which does not, and why you came to that judgment.


Here’s the answer.

  • The top panel takes annual counts of major hurricanes in the North Atlantic to create a probability distribution based on actual data from 1945 to 2022. For 2023 to 2050, the annual counts are randomly selected from this distribution.
  • For the middle panel, I took this probability distribution based on observations and shifted it — starting instantaneously in 2023 — one count to the right (so, for example, the probability of having 3 major hurricanes becomes the probability of having 4, and so on). This large shift is much larger than changes in counts projected for 2100, but this is just an exercise.
  • The bottom panel shows a time series based on a shift of 2 counts to the right, representing a much larger change in probabilities.
You can see the three probability distributions in the figure below, with colors to match the panel above. This sort of figure has become common in climate discussions, and you can see an example at the top of this post.


Let me suggest two important lessons from this exercise.

First, neither of the climate change series in the top panel comes anywhere close to meeting the IPCC criteria for the detection of climate change.

But wait a second there! We know that in the time series, the climate has in fact changed —
because I changed it — as shown in the shifted probabilities.

So, what gives?

It is not just possible, but often likely, that for specific climate variables, the underlying climate changes, and yet the consequences of those changes are not detectable in short (climatically speaking) time series.

I chose the period 1995 to 2050 because over that time frame my kids will enter their 50s, and be about my age today. It’s the same as me looking at a time series from the 1960s to today. In practice, a lot of climate research on detection and attribution uses much shorter time series.

It is standard today for climate advocates to link every extreme weather event and disaster to climate change.

My suspicion is that when they do so they are not actually saying anything about the detection or attribution of changes but rather, they are simply witnessing the reality of climate change and its deep importance to them.

Part of this witnessing may be to preemptively defend against concerns that if climate changes are not perceived to be large enough, people won’t have enough fear — no one wants to be accused of minimizing climate change.

Lesson: Just because the signal of climate change for particular variables cannot (yet) be detected in the context of historical variability does not mean that climate change is not real or important, and in many if not most cases a lack of signal is to be expected.

In fact, that is exactly what the IPCC concludes with respect to most extreme weather events, as shown in the table below and discussed here.

The white cells show where signal detection is not expected to be unequivocally achieved at present, by 2050, or by 2100 (respectively in the three right-most columns).


Advocates who promote every extreme event as being caused by, linked to, made worse by, or fueled by climate change are promoting misinformation in almost all cases.

It is an expression of faith, not science. This complicates public discussions of detection and attribution.

Some people are expressing a deeply held religious-like sentiment, and others are talking about data and evidence.

No wonder people talk past each other.

Second, you’ll note in the top figure in the panel above — the one with the black linear trend line — that there is a large decrease in major hurricane activity in the North Atlantic from 1965 to 2050. There were about four per year at the start of the time series and only two at the end, a drop of 50%.

That decrease is real in the sense that there are fewer major hurricanes toward the end of this record as compared to the beginning, but it has nothing to do with a change in the climate, as the annual probabilities do not change over the entire data range.

Compare the figure below, which shows the entire dataset from which the top figure in the panel above was taken. The below figure shows 1945 to 2080 and you can see an increase of 50% from the start to the end — but this trend also is not the result of a change in climate, as the annual probabilities are constant.


So, what gives?

Many climate variables exhibit large variability — since 1945 we’ve observed anywhere from 0 to 7 major hurricanes yearly in the North Atlantic, that’s a huge variation.

The three probability distributions graphed above represent annual counts of major hurricanes of 2.6 based on observations (black), and about 3.6 (red) and 4.6 (green) in the two shifted probabilities.

The shifted probabilities represent increases in major hurricane annual counts of ~40% and ~80% — much larger than almost all model projections assessed by Knutson et al. for 2100 (and many actually project a decrease).

Many projected changes in the behavior of extreme events due to climate change are in fact small in the context of historical variability.

That is just a fact — have another look at the IPCC table above.

Further, historical variability is sufficiently large that we can look at various time series and fool ourselves into thinking we see change when all we are observing is cherry-picked variability (see the two-time series above with the black linear trends).

Lesson: Natural variability is real and significant. It does not mean that climate change is not real or important, but that detecting signals is often difficult even when climate is changing and there is always a risk of erroneously detecting signals where none is present.

There is a good reason that climate change has been detected and attributed by the IPCC for temperature and precipitation at large spatial scales — this is where we have the most measurements and through aggregation, variability becomes smaller, making it easier to separate signal from noise.

Consider that there are millions of measurements of temperature and precipitation around the world, but there were only 78 major hurricanes in the North Atlantic from 1945 to 2022 — numbers matter!

But even for temperature, at local levels detection and attribution are challenging, as climate scientists Ed Hawkins explains (emphasis added):


The challenges of detection and attribution should tell us that both adaptation and mitigation policies must be built upon a foundation that involves justifications for action that are much broader than climate change alone.

So far, climate advocates have sought to shape perceptions of science to support a climate-change-is-everything agenda. We will have a lot more success if we instead shape policy to align with what science actually says.

Roger Pielke Jr. has been a professor at the University of Colorado since 2001. Previously, he was a staff scientist in the Environmental and Societal Impacts Group of the National Center for Atmospheric Research. He has degrees in mathematics, public policy, and political science, and is the author of numerous books. (Amazon).

Read the full post at The Honest Broker

How Activist Scientists Enforce Climate Misinformation Through Bullying And Other Tactics - Climate Change Dispatch
Wow, is that ever a stupid, stupid piece.
Amazingly stupid!

Pielke jr is an idiot, like his father.
His commentary doesn't address why the ABC story was corrected and instead uses cherry picked charts to argue that cherry picking is bad science. Which is not what the ABC corrections were about.

But lets just go and check this statement from Pielke jr, do you agree or disagree with Pielke jr:
"The IPCC has concluded that greenhouse gas emissions resulting from human activity are an important driver of changes in climate. And on this basis alone I am personally convinced that it makes sense to take action to limit greenhouse gas emissions.
 

canada-man

Well-known member
Jun 16, 2007
32,191
2,707
113
Toronto, Ontario
canadianmale.wordpress.com
The Real Cause of the Maui Wildfire Disaster


The Real Cause of the Maui Wildfire Disaster
1 day ago

Guest Blogger

91 Comments

From the Cliff Mass Weather Blog
Cliff Mass
This blog will discuss the key reason for the Maui disaster, one not discussed by the media and others: a high amplitude atmospheric wave forced by strong winds interacting with the mountains of northwest Maui.
An atmosphere wave that produced powerful, dry downslope winds on the western slopes of West Maui mountains.

A vertical cross-section of the predicted mountain wave.
Explained in detail below
The terrible disaster in Maui has been leading the news cycle for a week now, with media and others proposing many causes: climate change, drought, dry invasive grasses, and Hurricane Dora to name a few.
But none of them have identified the key reason why so many people died last week and why the damage was so extensive. None explained the 60-90 mph gusts that hit a very localized area. Winds strong enough to shear off wooden power poles, tear roofs apart, and down lines of power lines.

And it wasn’t Hurricane Dora, a relatively small tropical storm that passed 700 miles to the south of Hawaii.
Something else happened in Maui last week. Something capable of creating intense wind damage in one location and light winds a few miles away.
A phenomenon skillfully predicted by modern high-resolution models, and thus a feature we could have warned Lahaina’s population about. A phenomenon that would have been picked up by surface weather observations, if only West Maui had invested in inexpensive weather stations.
The Terrain
To understand what happened one must consider the terrain of West Maui (see below), which is dominated by terrain reaching approximately 5500 ft.

Looking eastward from a boat off of Lahaina, the terrain looms impressive (see below).

Picture courtesy of Professor Dale Durran, UW
Last Tuesday, strong winds approached the crest of the West Maui Mountains, not because of Hurricane Dora, but because of an unusually strong high-pressure area to the north.
We know this for several reasons. A map of sea level pressure (black lines), surface winds (wind barbs), and the standardized sea level pressure anomaly (difference) from normal (colors) at 9 AM Hawaii time on Tuesday are shown below.
High pressure is centered north of Hawaii and this high pressure was far more intense than normal just north and over Maui (indicated by the orange, red, and brown colors). The pressure anomalies due to the Hurricane Dora were very small in scale and limited to far south of Hawaii.
Hurricane Dora had little impact on Hawaii during this event, something confirmed by an expert at the National Hurricane Center.

Since winds approaching the West Maui mountains will be so important consider the situation at the same time for an elevation of around 2600 ft (925 hPa pressure)– see below. You can see the high to the north, the location of Maui (white arrow), and the hurricane (red arrow).
The wind anomaly from normal of the winds at this level is shown in color. Look carefully and you will see gray color over Maui…. five standard deviations from normal….which means VERY unusual. You will also note the clear separation of the strong winds of Dora from what hit Maui.

Not not only were strong winds approaching the West Maui mountains, but another feature that can foster a very strong mountain response also occurred: an area of stable air near the crest level of the terrain.
This is illustrated by the vertical sounding at Hilo on the Big Island six hours earlier (see below). The black line on the right shows the temperature with height. When the temperature does not fall rapidly with height, the atmosphere is generally stable. When it is constant with height or warming with height (an inversion), it is very stable.

Trust me, this stable layer is important. When strong winds accompanied by a stable layer near or just above crest level hits a terrain barrier, a high-amplitude mountain wave can form.
A wave that can produce intense downslope winds.
And this is exactly what happened last Tuesday over Maui.
The Smoking Gun

Last week, I asked David Ovens, a highly skillful atmospheric modeler in my group at the UW, to run a forecast of the Maui event using the WRF model at very high resolution (1.3 km grid spacing).
I was stunned by the simulation, which revealed the real cause of the disaster: a high-amplitude mountains wave with very strong downslope flow on the West Maui Mountains.
Below is a forecast vertical cross-section of the situation around 2100 UTC August 8th (11 AM Hawaii time). Winds are shown by color shading and arrows. The solid lines are potential temperature.
An extraordinarily high amplitude wave had formed, with air descending the western side of the Maui Mountains, accelerating as it plummeted towards Lahaina. At low elevations, the flow abruptly ascended, in a feature often termed a hydraulic jump.

Analogous flow can occur for water flowing over a dam.

The descending flow was not only strong, but very, very dry, as shown by the vertical cross-section of relative humidity (see below). Relative humidities below 20% descended down the mountains, with the driest air well under 10%.

The combination of strong winds and dry air hugely promotes fire, including rapidly drying surface fuels such as grass.
It did not matter whether the grass or light vegetation were wet or dry the days or weeks before: this extraordinary atmospheric animal would ensure they were dry enough to burn. Prior dry conditions during the weeks before were immaterial.
Lack of Wind Observations on West Maui: How Do We Know the Model Forecasts are Correct?
The lack of wind observations on West Maui is stunning. I know of no other heavily populated areas with such a singular lack of wind observations. Very bad.
So how do we know these model simulations are correct?
First, there is the damage, even before the fires got going. Power poles snapped in two. Powerlines down. Great physical damage to structures. Such damage is consistent with winds gusting to 60-90 mph.
Second, there are videos indicating such strong winds, and a number of people estimated wind gusts over 60 mph. Check this video.

Maui’s lack of observations is not responsible and cripples the ability of the county and local authorities to warn people of such events.
Confirming the Model’s Prediction on Hawaii
Similarly strong winds were predicted by the model over the northwest side of the Big Island, where strong flow hit similarly high terrain (see map below and wind forecast beneath it)

Strongest winds indicated by the orange color

But unlike Maui, we do have a good observation on Hawaii, at the USDA RAWS site at Kohala Ranch (see red arrow above).

During this event, the winds gusted to 82 mph! (see proof below). Confirmed!

The Bottom Line
The Maui event was the result of a high amplitude mountain wave and strong, dry downslope flow on the western slopes of the mountains of West Maui. The mountain wave was the result of strong approaching flow and a stable layer near the crest level of the Maui Mountains.
Strong dry winds support fire and result in rapid movement of the flame front, as well as moving embers ahead. The winds could well have started the fire by damaging infrastructure. As noted in my earlier blog, a huge reserve of dry, flammable grasses was in place.
This event was not the result of climate change, Hurricane Dora, or an extended drought. It resulted from an unusually intense mountain wave/downslope windstorm produced by a fairly rare convergence of conditions.
This event was highly predictable using modern weather prediction technology. The combination of a reasonable weather observing network (which does not exist on Maui) and the use of state-of-science weather modeling, the population of Maui can receive far better warnings that can prevent this tragedy from occurring again.


The Real Cause of the Maui Wildfire Disaster • Watts Up With That?
 

Frankfooter

dangling member
Apr 10, 2015
94,243
23,690
113
Watts up with that is a science denier site.

The common currency in the science denier forest fire points is that they like to find one spark, wind, power line or campfire that they can say started the fire while ignoring the fact that without the warming that dried all the vegetation it would have been just another bush fire.

The fires are worse because the warming has dried out trees and vegetation.

The warming is everywhere, check out the ocean temps, they are out of control.
 

oil&gas

Well-known member
Apr 16, 2002
13,964
2,252
113
Ghawar
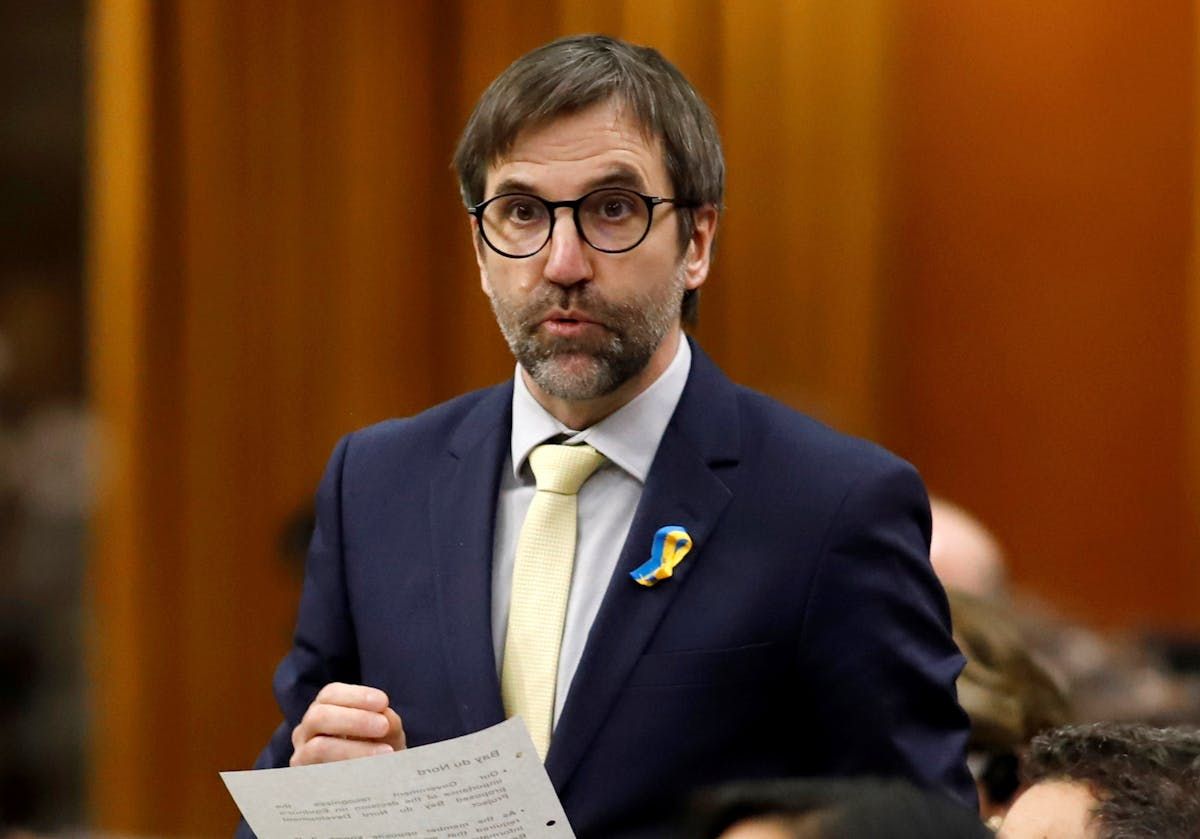
Guilbeault not concerned by new Equinor exploration off of Newfoundland and Labrador
Aug 17, 2023

Federal Climate Change Minister Steven Guilbeault appeared to tacitly endorse expanded exploration of the Bay du Nord offshore oil field announced this week by Norwegian oil giant Equinor.

Equinor Canada Ltd. has awarded a contract for the Hercules semi-submersible drilling rig to conduct an exploration drilling program offshore Newfoundland in 2024.

The company said the program will focus on two additional wells located approximately 500 kilometres off Newfoundland’s shores in the Flemish Pass Basin to support “continued optimization” of the Bay du Nord development.

“As you know, we’re in the process of putting in place a number of measures to fight climate change in Canada,” Guilbeault said Wednesday in response to questions.

He said the government will propose new regulations in the fall that will require emissions at production sites to be capped and phased out.

The minister and other officials were speaking to reporters Wednesday about funding to help Inuit members of Nunatsiavut in Labrador to conduct climate change research and monitoring.

Guilbeault defended Ottawa’s decision in April to approve the controversial Bay du Nord megaproject despite pushback from environmentalists and climatologists.

The field could produce as many as a billion barrels of oil over its lifespan, although the company later announced it was putting development on hold for up to three years.

“We need to ensure that whatever oil or gas we’re still using in 2050, that the emissions from those operations are captured and sequestered, and that’s exactly one of the conditions we’ve put for the first time in the history of Canada in the approval of the Bay du Nord project.”

Asked why Canada would approve new oil development when organizations such as the Intergovernmental Panel on Climate Change and the International Energy Agency strongly advise against it, Guilbeault appeared to split hairs.

“If you look carefully at the language they use, they say we shouldn’t explore for new oil fields,” he said. “So, no new oil frontiers, if you wish, and that’s exactly what we’re doing in Canada. We’re not allowing companies to go in places where there isn’t already oil development happening.”

The agencies do specify oil “fields” in their assessments, but also say new exploration should cease if targets are to be met.

And Guilbeault said Canada and other oil-producing countries are still debating whether to include Scope 3 emissions in their net-zero targets and regulations.

Scope 3 emissions include those emitted by the processing and burning of fuel once it’s out of the producer’s hands (downstream) and those emitted to provide products and services used by the company (upstream). Downstream emissions usually account for most of the emissions from fossil fuel development.

“I think there is a global discussion about impact assessment and what should and shouldn’t be part of it,” Guilbeault said.


canada-man

Well-known member
Jun 16, 2007
32,191
2,707
113
Toronto, Ontario
canadianmale.wordpress.com
Climate Change Misinformation Wins in Montana

From the CO2 Coalition

In Montana Climate Kids Lawsuit, Climate Change Misinformation Wins

By Gregory Wrightstone

A group of young people in Montana won a landmark lawsuit on August 14, when a judge ruled as unconstitutional the state’s failure to consider climate change when approving fossil fuel projects. The judge accepted as fact allegations made by plaintiffs in the suit, which we will systematically show to be patently false.

Just some of the catastrophes accepted as fact by the judge included:

  • More heat waves and extreme summer heat
  • Days above 90 degrees increased by 20 days between 1970 and 2015
  • Increased drought and lower precipitation
We will soon have a complete rebuttal to the Montana lawsuit. First, the plaintiffs cherry-picked the time frame of 1970 to 2015 to select days above 90 degrees Fahrenheit when the full data show that there has been no discernible trend since the 1920s. In fact, the period between 1920-40 looks remarkably similar to the most recent several decades.


Increasing drought and lack of precipitation? That isn’t what the data show.


According to Judge Kathy Seeley of Montana District Court, Montana is a “major emitter of greenhouse gas emissions in the world.” She added that the state’s emissions “have been proven to be a substantial factor” in affecting the climate. Is that the case?

Montana’s CO2 emissions are 0.6% of the total U.S. emissions. If Montana had gone to zero emissions of CO2 in 2010, it would only avert 0.0004 degree Fahrenheit of greenhouse warming by 2050 and 0.001 degree by 2100, according to the MAGICC simulator, a tool created by a consortium of climate research institutes including the The National Center for Atmospheric Research. These numbers are far below our ability to even measure and certainly not the “substantial factor” as claimed.


Gregory Wrightstone is a geologist; executive director of the CO2 Coalition, Arlington, VA; and author of Inconvenient Facts: The Science That Al Gore Doesn’t Want You to Know.

Climate Change Misinformation Wins in Montana • Watts Up With That?
 

oil&gas

Well-known member
Apr 16, 2002
13,964
2,252
113
Ghawar
N.L. continues to bet big on the offshore, despite net zero commitments drawing closer
Mar 24, 2023

It's full speed ahead in Newfoundland and Labrador when it comes to the offshore oil and gas industry, with the provincial government signalling strongly in Thursday's budget that it's not ready to start weaning itself off fossil fuels.

The province plans to spend roughly the same amount of money in the 2023 budget to help build the oil and gas sector as it has set aside to help combat the effects of climate change, and its commitment to net zero emissions by 2050.

The Liberal government will pump $50 million into a program launched three years ago that's designed to encourage oil companies to drill exploration wells in hopes that it will lead to the next big find, and more production. This year's beneficiary? ExxonMobil, the lead partner in both the Hibernia and Hebron oil fields, and a company that posted record profits last year.

And the taxpayer-funded seismic program, which uses seismic waves to search for oil and gas and was suspended a year ago, has been resurrected with a $13-million injection of cash.

These seismic results are offered up to oil companies, and officials say the program has successfully enticed companies to bid large sums on offshore land parcels, with a commitment to carry out exploration.

And that's not all.

All four of the province's mature offshore fields are located in the Jeanne d'Arc Basin, but only the oil is produced, while the ample gas resource is either burned off, used to power the oil-producing platform, or reinjected into the reservoir.

The oil companies that operate in the offshore have long said that extracting the gas and delivering it to market is not a viable option, but there's an increasing global demand for natural gas, and that's raising new questions about whether the resource should be developed.

As a result, the budget includes $4.8 million to carry out an assessment of the volume of gas within the oil reservoirs in the Jeanne d'Arc Basin.

So that's a nearly $70-million investment into an industry that's come under increasing scrutiny for its contribution to climate change. It comes at a time when climatologists talk of an irreversible climate disaster lurking around the corner, and the need to transition away from fossil fuels.

Meanwhile, the province will spend nearly $60 million to help homeowners, businesses and the public sector reduce greenhouse gas emissions through rebates and project funding. Some $3 million has also been earmarked to support the transition to electric vehicles.

Businesses can also avail of a 20 per cent tax credit for the capital cost of projects that promote conservation and clean energy generation, and the efficient use of fossil fuels. But it's not known how much uptake there will be for this program, so there is no estimate in the budget.

The diverging priorities illustrate the tightrope being walked by the provincial government as it tries to balance the critical royalties and jobs in the oil and gas sector, with the need to transition to a greener, lower-emitting economy.

Oil royalties are projected to account for 12 per cent of the province's revenues for the coming year, or $1.1 billion.

Production is expected to be stable at nearly 84 million barrels, with the province forecasting an average price per barrel of $86 US.

It's also shaping up to be a notable year in that construction is expected to resume on the West White Rose extension project, the Terra Nova floating production, storage and offloading vessel is scheduled to resume production for the first time in more than three years, and Equinor has said a sanction decision for its massive Bay du Nord project could occur in the next 12 months.

When questioned about the oil-climate change balancing act, Finance Minister Siobhan Coady returned to the province's standard messaging, saying fossil fuels will be needed for decades into the future and the oil produced in the offshore has more advantages than most other jurisdictions.

She said oil from the Hibernia, Hebron, Terra Nova and White Rose fields is produced at lower emissions than the global average and at the highest environmental and labour standards.

And she emphasized that the $50-million offshore exploration incentive is not a direct subsidy, but a redirection of deposits forfeited by companies who failed to make good on previous exploration commitments.

"The world needs oil. We have oil, we have low-carbon oil," said Coady.

Energy Minister Andrew Parsons said the exploration incentive program will not be extended beyond this year, and he hinted that the deposit forfeitures in future years may be directed toward green energy projects.

As for concerns about climate change, Parsons said the province takes the issue very seriously and is making headway in the non-renewable sector in areas such as wind-to-hydrogen projects.

But he said there is a strong demand for fossil fuels, companies continue to show an interest in the province's resources, and the revenue from oil and gas is crucial to paying for vital services such as health and education.

As for the potential of a natural gas industry, Parsons said a study to determine whether it's viable is long overdue.

"We just think there's a pragmatic approach to looking at the strengths that we have on both sides without giving up an opportunity," he said of the balance between fighting climate change and developing non-renewable resources such as oil and gas.

He said "multiple jurisdictions" have contacted the province about its offshore gas potential, "so we're seeing if we have an opportunity to be in that field now."

As for the commitment to net-zero emissions by 2050, Coady said the province remains committed to that goal, and said ongoing efforts to lower emissions in the offshore and throughout society will help with the transition to a low-carbon economy.


shack

Nitpicker Extraordinaire
Oct 2, 2001
53,237
11,411
113
Toronto
First tropical storm to hit southern California in 84 years.


It seems that every day there is at least one new severe weather event occurring. I'm not alarmed. But I think that the people in Baja are plenty alarmed.
 
Ashley Madison
Toronto Escorts