Greta Thunberg warns of ‘catastrophic‘ climate crisis at England‘s Glastonbury Festival, says we need to ‘prioritize people over profit and greed’

Frankfooter

dangling member
Apr 10, 2015
92,487
22,701
113
Hmm. The so-called expert in "settled science" has now calculated the temperature difference starting from a La Nina year that was artificially below temperature trends. It doesn't look like he knows the difference between climate and weather.

The temperatures I cited were within the normal range of temperatures and are the numbers we must stick with.

As noted, the IPCC's prediction was off by nearly 300%. That sure doesn't seem "spectacularly accurate" to me. 😀

BTW, Frankfooter's artificially inflated number is still only a little more than half of what the IPCC predicted. According to Frankfooter, a prediction that is off by nearly 100% is "spectacularly accurate." 😀
See?

No matter how often I try to explain basic stats to you, including the concept of 'cherry picking' you just can't understand it.
Its really quite amazing.

Look, all of these sets of numbers are correct and came from the same NASA source:
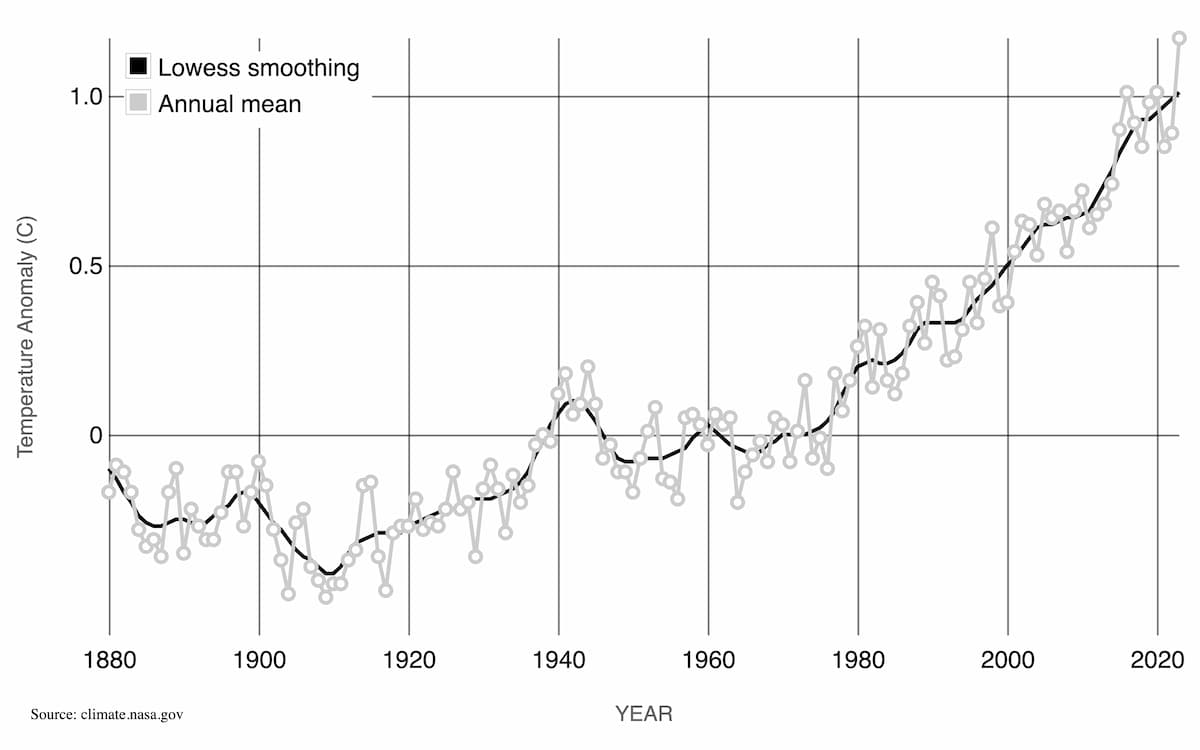
Your numbers - cherry picked to find the lowest possible change
- 2001 temperature anomaly: 0.54ºC.
- 2021 temperature anomaly: 0.85ºC.
The increase over 20 years: 0.31ºC.

My numbers - cherry picked one year later to find a higher number
- 2000 temperature anomaly: 0.39ºC.
- 2020 temperature anomaly: 1.02ºC.
The increase over 20 years: 0.63ºC.

I can cherry pick that even more to find higher numbers
- 1996 temperature anomaly: 0.33ºC.
- 2006 temperature anomaly: 1.02ºC.
The increase over 20 years: 0.69ºC.

The IPCC projection is for 0.2ºC per decade, which is where the 'trend' sits. As posted in charts above.

The really basic concept of 'cherry picking data' is that you ignore trends and try to find the one specific set of data points that you try to claim = a trend.
Its a really fucking stupid technique, you'd be failed out of first year university if you tried this shite.

Cherry picking, suppressing evidence, or the fallacy of incomplete evidence is the act of pointing to individual cases or data that seem to confirm a particular position while ignoring a significant portion of related and similar cases or data that may contradict that position. Cherry picking may be committed intentionally or unintentionally.[2]

The only real question is whether you are really so stupid as to not understand this concept despited being told about it for 7 years or if you are so dishonest and so stupid that you think you'd get away with the same trick that has failed you for 7 years. I can't figure it out, are you that stupid or that stupidly dishonest?
 

Moviefan-2

Court Jester
Oct 17, 2011
10,489
172
63
The IPCC projection is for 0.2ºC per decade, which is where the 'trend' sits. As posted in charts above.
A 0.2ºC increase per decade would be 2ºC over the century.

The IPCC predicted the increase would be almost as high as 6ºC over the century, particularly in the current situation where man-made emissions continue to break all-time world records.


Frankfooter's calculation shows the warming trend is only one-third what the IPCC predicted under the current emissions scenario. Thus, we can all agree the IPCC's prediction was spectacularly wrong.
 

Moviefan-2

Court Jester
Oct 17, 2011
10,489
172
63
I stop debating with climate cultists like Frankie because no matter how much facts and evidence you give them to show just how silly their position is, they ignore it. In essence it is they that are the true deniers.
Perhaps he'll accept his own calculation which shows the IPCC's prediction to have been spectacularly wrong. 👍
 

Frankfooter

dangling member
Apr 10, 2015
92,487
22,701
113
A 0.2ºC increase per decade would be 2ºC over the century.

The IPCC predicted the increase would be almost as high as 6ºC over the century, particularly in the current situation where man-made emissions continue to break all-time world records.
Yes, that is the present trend on an exponential curve.
It'll get higher as we progress along the curve.

Do I need to explain what an exponential curve is to you next?

Perhaps he'll accept his own calculation which shows the IPCC's prediction to have been spectacularly wrong. 👍
I think I'd need to be hit over the head by 7-10 bricks to be able to do math the way you do math, moviefan.
Don't suggest it, by the way.

Its pretty shocking how you can post the numbers from NASA that show the IPCC projections are correct and then somehow claim you just proved they are wrong.
You really are the Dunning Kruger king of TERB.

By the way, its the IPCC and NASA that has done the calculations, not me.
They are presented in the chart that shows the temperatures you posted show the IPCC projections to spectacularly accurate.
 

bver_hunter

Well-known member
Nov 5, 2005
29,500
7,391
113
An interesting update: bver_hunter was twice asked if he believes mathematically challenged Frankfooter's posts are the types of posts that would be written by a rational person.

There was no response.

His silence speaks volumes. 🙂
When your questions make logical sense then they will get a response right away.
I have no idea what Post you are referring to? Frankfooter has a far higher IQ than all of the right wingers on this Board!!

As noted, the IPCC's prediction was off by nearly 300%. That sure doesn't seem "spectacularly accurate" to me. 😀
BTW, Frankfooter's artificially inflated number is still only a little more than half of what the IPCC predicted. According to Frankfooter, a prediction that is off by nearly 100% is "spectacularly accurate." 😀
You better go and tell The Hill's Contributor about your take on the IPCC's predictions. He seems to think that their predictions were dead accurate!!

Today’s climate reality was predicted by IPCC 30 years ago — now what?


Moviefan-2

Court Jester
Oct 17, 2011
10,489
172
63
Frankfooter has a far higher IQ than all of the right wingers on this Board!!
Let's review.

Moviefan might be the most pathetic of the climate change deniers as he has admitted the planet is warming but then turns around and denies it. Same as he ignore the fact that the planet has warmed about 0.25ºC in the 7 years since the post he quoted.
2014 - 0.74ºC
2020 - 1.02C
Difference is 0.28ºC
- The period from 2014 to 2020 is not "7 years."
- The year 2020 is not "7 years since" 2014.
- The temperature anomaly on the NASA graph increased from 0.75ºC at the end of 2014 to 0.85ºC at the end of 2021.
- The difference between 0.75ºC and 0.85ºC is not 0.25ºC.

The actual difference in the "7 years since" the 2015 post is 0.1ºC - less than half the 0.25ºC he cited.
....all you can do is try to claim I made some math errors!!!!
For the record, I don't merely "claim" that subtracting 0.75 from 0.85 doesn't equal 0.25. It is a fact.

As was previously noted, students who have successfully completed Ontario's Grade 5 math curriculum are able to correctly calculate the difference. 👍
 

Moviefan-2

Court Jester
Oct 17, 2011
10,489
172
63
You better go and tell The Hill's Contributor about your take on the IPCC's predictions. He seems to think that their predictions were dead accurate!!

Today’s climate reality was predicted by IPCC 30 years ago — now what?

Perhaps someone should show him the news coverage from the release of the 2001 report, when there was a massive increase in the IPCC's predictions. 😀


Moviefan-2

Court Jester
Oct 17, 2011
10,489
172
63
Yes, that is the present trend on an exponential curve.
It'll get higher as we progress along the curve.

Do I need to explain what an exponential curve is to you next?
You could just provide the link to the post where you copied and pasted the big words you probably don't understand.

But it doesn't matter because your assertion is wrong. In fact, the IPCC's prediction was based on the calculation of temperature increases of 0.6ºC per decade.

"The 1990s was the warmest decade for 1,000 years, said the report. Temperatures rose by an average of 0.6C during the last century, with an increase in floods and droughts."


- IPCC's prediction: Temperature increases as high as 0.6ºC per decade.
- Frankfooter's calculation: 0.2ºC per decade.

Frankfooter says the actual increase so far is only one-third what the IPCC predicted in this current period of record-breaking emissions.

The IPCC's prediction remains spectacularly wrong.
 

Frankfooter

dangling member
Apr 10, 2015
92,487
22,701
113
Let's review.

For the record, I don't merely "claim" that subtracting 0.75 from 0.85 doesn't equal 0.25. It is a fact.

As was previously noted, students who have successfully completed Ontario's Grade 5 math curriculum are able to correctly calculate the difference. 👍
Hey moviefan.
Intentionally misquoting is really pathetic.
I get that you can't understand the science, can't understand what cherry picking data is but when you intentionally pull partial quotes to make false statements that's another thing.

Its stupid.
Really, really fucking stupid.
Stop it.

You posted NASA numbers that confirm the IPCC projections.
Then you idiotically say 'the IPCC is spectacularly wrong' based on your sad feelies.
 

Moviefan-2

Court Jester
Oct 17, 2011
10,489
172
63
Added bonus: Frankfooter's latest unsubstantiated claim that temperatures were supposed to increase exponentially sometime after the year 2020 means he has completely rejected Michael E, Mann's hockey stick graph, which showed temperatures skyrocketing up from 1990 onwards. 👍

 
Last edited:

Frankfooter

dangling member
Apr 10, 2015
92,487
22,701
113
You could just provide the link to the post where you copied and pasted the big words you probably don't understand.

But it doesn't matter because your assertion is wrong. In fact, the IPCC's prediction was based on the calculation of temperature increases of 0.6ºC per decade.

"The 1990s was the warmest decade for 1,000 years, said the report. Temperatures rose by an average of 0.6C during the last century, with an increase in floods and droughts."


- IPCC's prediction: Temperature increases as high as 0.6ºC per decade.
- Frankfooter's calculation: 0.2ºC per decade.

Frankfooter says the actual increase so far is only one-third what the IPCC predicted in this current period of record-breaking emissions.

The IPCC's prediction remains spectacularly wrong.
Oh god, here we go again.

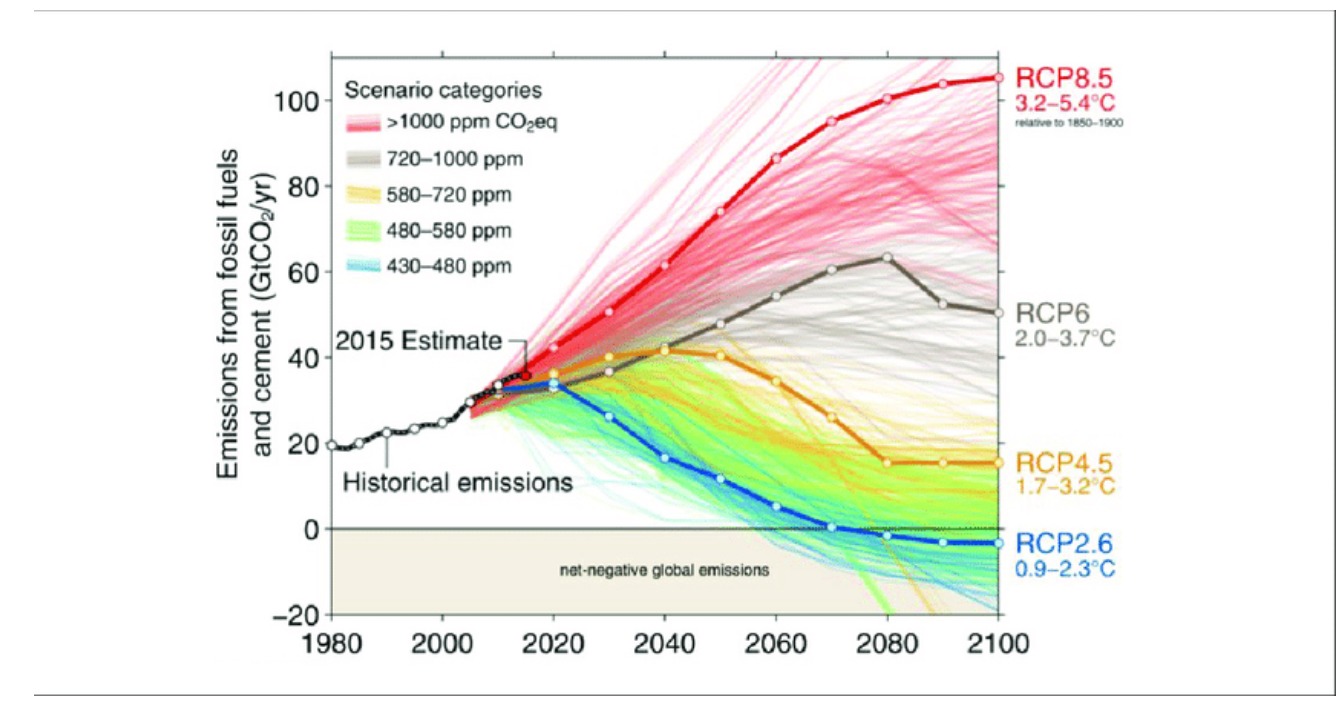
You posted an article about RCP 8.5, the worst case scenario then compared that with the median projections.
Of course they are fucking different, they are different projections based on different CO2 outputs.

Do you understand nothing?
 

Moviefan-2

Court Jester
Oct 17, 2011
10,489
172
63

Frankfooter

dangling member
Apr 10, 2015
92,487
22,701
113
Added bonus: Frankfooter's latest unsubstantiated claim that temperatures were supposed to increase exponentially sometime after the year 2020 means he has completely rejected Michael E, Mann's hockey stick graph, which showed temperatures skyrocketing upwards from the 1990 onwards. 👍

You posted a chart that shows exponential growth from 1850 to present day as proof that its not exponential?
Holy shit, you're on a roll of stupidity today.

Though its right along with you posting NASA's numbers that show the IPCC projections accurate and claiming it proves them 'spectacularly wrong'
 

Frankfooter

dangling member
Apr 10, 2015
92,487
22,701
113
Actually, I quoted Frankfooter's number.


- IPCC's prediction: Temperature increases as high as 0.6ºC per decade: https://www.theguardian.com/environment/2001/jan/23/globalwarming.climatechange2

- Frankfooter's calculation: 0.2ºC per decade.

😀
You really can't follow along, can you.
You compared my quote of the median projections with the Guardian's quote of the highest projections and then said 'SEE, THEY ARE DIFFEERRNENT'

This is like talking to a four year old.
 

Moviefan-2

Court Jester
Oct 17, 2011
10,489
172
63
Another laugh-out-loud observation.

The Guardian's story on the IPPC report from 2001:

"The 1990s was the warmest decade for 1,000 years, said the report. Temperatures rose by an average of 0.6C during the last century, with an increase in floods and droughts."


Frankfooter:

The IPCC projection is for 0.2ºC per decade, which is where the 'trend' sits.
Franky's question:

Do I need to explain what an exponential curve is to you next?
🤣
 
Last edited:

Moviefan-2

Court Jester
Oct 17, 2011
10,489
172
63
The IPCC projection is for 0.2ºC per decade, which is where the 'trend' sits. As posted in charts above.
You compared my quote of the median projections with the Guardian's quote of the highest projections and then said 'SEE, THEY ARE DIFFEERRNENT'.
So, Frankfooter says the "median projections" are for 0.2ºC per decade. Let's see how that compares with what he posted in 2015:

The IPCC worst case projections are for a median of 4ºC over one hundred years from a baseline of 1850-1900 years.
In fact, 0.2ºC and 0.4ºC are different.

Frankfooter's "median projections" for a period of record-high emissions are only half of what he said they were seven years ago. 👍
 

Frankfooter

dangling member
Apr 10, 2015
92,487
22,701
113
Another laugh-out-loud observation.

The Guardian's story on the IPPC report from 2001:

"The 1990s was the warmest decade for 1,000 years, said the report. Temperatures rose by an average of 0.6C during the last century, with an increase in floods and droughts."


Frankfooter:


Franky's question:


🤣

Its true!
You don't understand how exponential curves work either!
Holy shit.
 
  • Like
Reactions: bver_hunter

Frankfooter

dangling member
Apr 10, 2015
92,487
22,701
113
So, Frankfooter says the "median projections" are for 0.2ºC per decade. Let's see how that compares with what he posted in 2015:


In fact, 0.2ºC and 0.4ºC are different.

Frankfooter's "median projections" for a period of record-high emissions are only half of what he said they were seven years ago. 👍
Yes, of course they are fucking different.
They are different projections based on different CO2 outputs.
Wow, did you get another concussion?
 

Frankfooter

dangling member
Apr 10, 2015
92,487
22,701
113
Your so--called expert with the high IQ thinks a temperature change from 0.6ºC per decade to 0.2ºC per decade is an exponential increase. 😀
If you change from 0.2ºC per decade over time to 0.6ºC over time (which would happen if you follow the higher CO2 emissions of RCP 8.5) this would be an exponential curve.
It all depends on whether we curtail CO2 emissions to end the exponential growth like RCP 2.5 or let the right wingers take us to the thermal maximum of RCP 8.5.

 
  • Like
Reactions: bver_hunter
Ashley Madison
Toronto Escorts