CBC report - Most Canadians don't think humans are the main cause of climate change

Moviefan-2

Court Jester
Oct 17, 2011
10,489
171
63
I wonder what kind of assessment one would make looking at the updated version of Frankfooter's greatest hits.

- Nov. 10, 2015 -- He calculated that the "pre-industrial age" refers to the year 1990: https://terb.cc/vbulletin/showthrea...armer-Planet&p=5394609&viewfull=1#post5394609. He repeated that claim on Nov. 21: https://terb.cc/vbulletin/showthrea...ing-Point%92&p=5404144&viewfull=1#post5404144

- Nov. 21, 2015 -- He claimed it was "conspiracy thread business" to assert that NASA's pre-adjusted data (which ran to the end of May) showed there wasn't a single month in 2015 that was a record breaker: https://terb.cc/vbulletin/showthrea...-HottestYear&p=5403467&viewfull=1#post5403467. He spent an entire weekend making that argument until he was finally forced to concede that I was right.

- Nov. 27, 2015 -- This is still one of my favourites. He posted a graph that he said shows the "IPCC's projection" for 2015: https://terb.cc/vbulletin/showthrea...-HottestYear&p=5410384&viewfull=1#post5410384. Then, after it was explained to him that the graph shows the IPCC's predictions have been spectacularly wrong, he said it was "not an IPCC projection" and ran away from his own graph: https://terb.cc/vbulletin/showthrea...-HottestYear&p=5416739&viewfull=1#post5416739

- Nov. 29, 2015 -- He said NASA and NOAA don't use sea surface temperatures in their calculations of the global temperature anomalies: https://terb.cc/vbulletin/showthrea...imate-Change&p=5411862&viewfull=1#post5411862. Actually, they do.

- Dec. 1, 2015 -- Another classic. He said the ninth month of the year is "March": https://terb.cc/vbulletin/showthrea...-HottestYear&p=5414060&viewfull=1#post5414060

- Dec. 5, 2015 -- He posted what he said is a Met Office graph that shows updated HadCRUT4 data: https://terb.cc/vbulletin/showthrea...-HottestYear&p=5416886&viewfull=1#post5416886. In fact, the graph came from Columbia University and uses the entirely different NASA data.

- Jan. 8, 2016 -- He said NASA has "never altered any data, all they did was alter the weighting of ocean temperature readings....": https://terb.cc/vbulletin/showthrea...-warming-bet&p=5443355&viewfull=1#post5443355

- Jan. 10, 2016 -- He said I was "lying" when I said that a temperature change from 0.68ºC to 0.83ºC is an increase of 0.15ºC: https://terb.cc/vbulletin/showthrea...-warming-bet&p=5445053&viewfull=1#post5445053

- Feb. 3, 2016 -- He said the calculation that the average of 0.75 + 0.82 + 0.84 + 0.71 + 0.71 is 0.766 is "denier math": https://terb.cc/vbulletin/showthread.php?550100-The-End-is-Near&p=5466417&viewfull=1#post5466417

- Feb. 4, 2016 -- He called it "lying your face off" when I said the difference between 0.43 and 0.68 is 0.25: https://terb.cc/vbulletin/showthread.php?550100-The-End-is-Near&p=5466781&viewfull=1#post5466781

- Feb. 8, 2016 -- A new gem. He said the graphs on NASA's Vital Signs of the Planet page were "fake": https://terb.cc/vbulletin/showthrea...e-change-yet&p=5470561&viewfull=1#post5470561. He repeated the claim on Feb. 13 when he said NASA graphs had been "possibly doctored": https://terb.cc/vbulletin/showthrea...e-change-yet&p=5473971&viewfull=1#post5473971

- Feb. 11, 2016 -- He dismissed NASA GISS director Gavin Schmidt's graph of temperature anomalies as "dodgy": https://terb.cc/vbulletin/showthrea...e-change-yet&p=5472913&viewfull=1#post5472913

- Feb. 11, 2016 -- He said NASA GISS director Gavin Schmidt's Twitter account isn't "legit": https://terb.cc/vbulletin/showthrea...e-change-yet&p=5472991&viewfull=1#post5472991

- Feb. 20, 2016 -- He said it was a "blatantly false claim" that the difference between 0.74 and 0.84 is 0.10: https://terb.cc/vbulletin/showthrea...e-change-yet&p=5479780&viewfull=1#post5479780

-- March 3, 2016 -- He said it's "not possible" for 0.89 to equal 0.89: https://terb.cc/vbulletin/showthrea...imate-change&p=5489838&viewfull=1#post5489838
 

twizz

Banned
Mar 8, 2014
1,974
0
0
Climate Change Could Boost Toxic Algae Along Pacific Coast: New Research
8 hours ago | Updated 8 hours ago

Bob Weber, The Canadian Press CP

A recently published study suggests climate change may encourage longer and more frequent blooms of toxic algae along Canada's Pacific coast.

The research on the presence of algae toxins in marine mammals along the Alaska coastline holds a warning for British Columbia, said study author Kathi Lefebvre.

"It's the same coastline," said Lefebvre, a biologist with the U.S.-based National Oceanic and Atmospheric Administration. "Those regions are at risk in the same way as were Alaska and Washington."

Lefebvre and her colleagues studied the carcasses of more than 900 Alaskan mammals from seals to whales to look for the presence of domoic acid and saxotoxin, two common and potentially lethal algae-produced toxins.

Those toxins have been found before in Canadian waters. In 1987, more than 100 people became ill and several died after eating tainted mussels in Prince Edward Island.

Blooms of the algae that produce those toxins are increasingly common in California, where they regularly poison sea lions. And saxotoxin has long been present in shellfish in some parts of Alaska.

But a sea lion suffering from domoic acid poisoning, which causes seizures and death, had never been found north of California — until last year when one was found in Washington.

"There was a big bloom of domoic acid (that) year," Lefebvre said.

'Is this what the future holds?'

"The concern is that it was correlated with the warmer waters. Is this what the future holds? If we have continued warming water, will there be more toxic blooms? Will they be moving North?"

It turns out they already have.

Of the 13 Alaskan mammal species examined in Lefebvre's work, low levels of domoic acid was found in all of them and saxotoxin in 10 of them.

"We really did not expect to see it in all these animals everywhere," Lefebvre said. "We don't know if these animals had high enough doses to have health impacts. We just know that the toxins were present.

"This tells us the risk is there. They may not be in high enough concentrations yet to cause health impacts, but our question is what does the future hold in terms of increasing algae blooms as the waters warm?"

"This tells us the risk is there."

The temperature of Alaskan waters has gone up by almost three degrees over the last decade.

Lefebvre acknowledges her study, which depended on carcasses harvested by hunters or washed up on the beach, doesn't indicate whether toxin levels are stable or growing.

"We are monitoring more so we're going to see more," she said. "But in general we do know that the conditions are changing to be more favourable for algal blooms."

Economic impact

Even if the blooms don't kill sea mammals, they're one more stressor in a changing environment.

Blooms of toxin-producing algae also have major economic impacts. Last year's record bloom off the U.S. Pacific Northwest closed fisheries for many lucrative species, including razor clams and Dungeness crabs.

More research is needed into how the toxins move through the food web, as well as on trends in algal blooms over time. Scientists also need to ask if changes in toxin levels are linked to climate changes.

"This is something we need to pay attention to and it could become a bigger issue."

http://m.huffpost.com/ca/entry/9451080
 

MattRoxx

Call me anti-fascist
Nov 13, 2011
6,752
3
0
I get around.
Moviefan-2 said:
I wonder what kind of assessment one would make looking at the updated version of Frankfooter's greatest hits.
You don't want to know my assessment of both of you.

Climate Change Could Boost Toxic Algae Along Pacific Coast: New Research


Even if the blooms don't kill sea mammals, they're one more stressor in a changing environment.
Yes.
I expect that there will be interrelated and accelerating cascade effects which even computer models cannot foresee.
 

Frankfooter

dangling member
Apr 10, 2015
91,708
22,201
113
I wonder what kind of assessment one would make looking at the updated version of Frankfooter's greatest hits.
Its a great list of Dunning-Kruger type arguments, each and every one a false claim based on your ignorance.
The proof is in this large and seemingly impressive list, yet each and every statement full of major flaws of reasoning, symptomatic of Dunning-Kruger.

In fact, I challenge moviefan to pick any one of those charges and I'll prove that there are major flaws of reasoning showing his ignorance.

After all, he's still trying to prove that 0.87ºC isn't as high as 0.83ºC by posting large numbers of quotes that only confirm his ignorance.

Go ahead, loser, pick one of those charges and we'll use it to prove your Dunning-Kruger.
 

Moviefan-2

Court Jester
Oct 17, 2011
10,489
171
63
In fact, I challenge moviefan to pick any one of those charges and I'll prove that there are major flaws of reasoning showing his ignorance.
They're all so entertaining, it's hard to pick a favourite.

Let's go with one that Franky can't possibly think he'll bullshit his way out of.

- Nov. 29, 2015 -- He said NASA and NOAA don't use sea surface temperatures in their calculations of the global temperature anomalies: https://terb.cc/vbulletin/showthrea...imate-Change&p=5411862&viewfull=1#post5411862. Actually, they do.

The Hadcrut numbers are lower then NOAA and NASA in general, since they include sea surface temperature while the others do air temperatures.
http://data.giss.nasa.gov/gistemp/updates_v3/ersst4vs3b/

And just in case Frankfooter has forgotten his reply after I corrected him:

Yup, you are correct....
(For the record, the actual reason that HadCRUT reports different temperature anomalies than NASA and NOAA is because the Met Office uses a different baseline for determining the anomalies.)
 

Frankfooter

dangling member
Apr 10, 2015
91,708
22,201
113
They're all so entertaining, it's hard to pick a favourite.

Let's go with one that Franky can't possibly think he'll bullshit his way out of.

- Nov. 29, 2015 -- He said NASA and NOAA don't use sea surface temperatures in their calculations of the global temperature anomalies: https://terb.cc/vbulletin/showthrea...imate-Change&p=5411862&viewfull=1#post5411862. Actually, they do.
This is a good example, thanks for bringing it up. Because yes, I did make a mistake. What makes it a good example is that I admitted I made that mistake, learned some more about HadCRUT, NOAA and NASA and never made that mistake again. So what you claim as a 'greatest hit' infers that I continue to make this as a known false claim. But its not, I made a mistake and corrected it, but you, in your Dunning-Kruger keep posting it as if it were a continuing claim.

Now you can own up and state that the list you call my greatest hits, is a list of errors I made and corrected, that would be the correct statement. But instead you continue to post this as if I continue to make this claim.

That, my loser friend, is what it is fair to call a major flaw in reasoning.
You can't tell the difference between an error admitted and corrected and a continuing false claim.
In fact, I challenge moviefan to pick any one of those charges and I'll prove that there are major flaws of reasoning showing his ignorance.
That backs up my claim and is example #1 for your Dunning-Kruger effect.

And for the record, here's the post where I admitted I made the mistake:
Yup, you are correct, I made two mistakes in one day.
As stated on the other thread, was perusing a bob tisdale post and forgot who I was reading.
I should know better then to let that shit get by me, shouldn't I?
 

Moviefan-2

Court Jester
Oct 17, 2011
10,489
171
63
I made a mistake and corrected it, but you, in your Dunning-Kruger keep posting it as if it were a continuing claim.
Nonsense. I have cited the date of the posting (Nov. 29, 2015) every time.

But you're being far too easy on yourself.

Given all of the insults you have hurled at others on this matter, it was an astonishing error.

Indeed, you're admission that you knew nothing about the global temperature anomalies came months after you called myself and others all kinds of names for questioning the changes that NOAA and NASA made to the data. You knew nothing about the subject yourself, yet insisted on telling others how stupid they were.

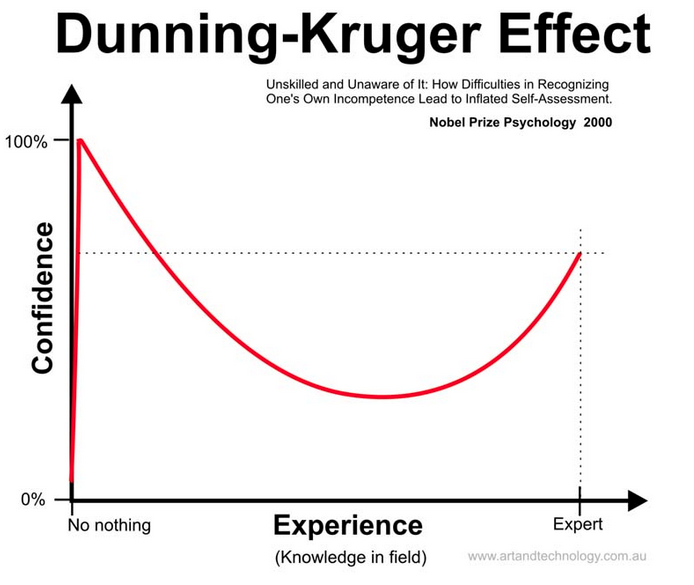
Your behaviour was, in fact, a perfect example of the Dunning-Kruger effect.

And should I mention that since you don't know how to read graphs and admit that you knew nothing about the subject back in May of last year (before your November admission), you are hardly in a position to challenge the "consensus" view on who won the bet.
 

Frankfooter

dangling member
Apr 10, 2015
91,708
22,201
113
Nonsense. I have cited the date of the posting (Nov. 29, 2015) every time.
Stating the date of the post but not admitting that I admitted the mistake and corrected it is a flaw in reasoning.
You continue to post your claim as if I continue to make that claim, instead of stating and then correcting it.

- Nov. 29, 2015 -- He {once} said NASA and NOAA don't use sea surface temperatures in their calculations of the global temperature anomalies: https://terb.cc/vbulletin/showthread...=1#post5411862. Actually, they do {and he admitted and corrected the mistake later}
That would be an accurate statement with added red words, but that's not what you said.


Your behaviour was, in fact, a perfect example of the Dunning-Kruger effect.
Not at all, my behaviour was the opposite of Dunning-Kruger, I admitted I made a mistake and had more to learn and then went and learned more.
As wiki describes Dunning-Kruger:
The Dunning–Kruger effect is a cognitive bias in which relatively unskilled persons suffer illusory superiority, mistakenly assessing their ability to be much higher than it really is. Dunning and Kruger attributed this bias to a metacognitive inability of the unskilled to recognize their own ineptitude and evaluate their own ability accurately.
https://en.wikipedia.org/wiki/Dunning–Kruger_effect

I admitted I needed to learn more and did so, that's showing the cognitive ability to assess my own abilities and work to make them better.
You, on the other hand, continue to make the same claims, including the one above, even after they've been shown to be wrong, that's Dunning-Kruger, never being able to assess your errors.

But of course, as a suffer, you will never understand that, will you?


Frankfooter

dangling member
Apr 10, 2015
91,708
22,201
113
p.s. 2015 Hottest year since record taking, February set temperature records around the world.

http://www.thestar.com/news/world/2016/03/14/nasa-says-warm-february-set-records-worldwide.html
Yes, Michael Mann is making that argument that February hit the 2ºC mark from pre-industrial times. His argument is that up to now we've been using 1850-1900 as the baseline, but that he says there was already 0.2ºC anthropogenic warming by then. He suggests we use 1750-1850 as the baseline, or zero, for reference. He makes a good case, and that would but February's anomaly at 2ºC for the first time ever, a temperature change the globe agrees we don't want to hit.


http://www.huffingtonpost.com/micha...to-dangerous-planetary-warming_b_8841534.html
 

Moviefan-2

Court Jester
Oct 17, 2011
10,489
171
63
You continue to post your claim as if I continue to make that claim, instead of stating and then correcting it.
You didn't correct it. I did.

And at no point did I say that you "continue to make that claim." You're grasping at straws because you challenged me to find an example and I was quickly able to find one where it is clear that you didn't know what you were talking about (and didn't realize it, Mr. Dunning-Kruger).

But let's consider your claim that you have taken the time to learn about the data and how the graphs work.

If that's true, then you will acknowledge that the following statement -- which has been repeated several times in various ways and which you have never corrected -- is erroneous.

We did not bet on a year to year change from 2014.
Let's see the proof that you have actually learned this subject. Acknowledge that your statement quoted above is false and that the year-over-year increase from the original bet can be applied to the graph NASA is now using.
 

Frankfooter

dangling member
Apr 10, 2015
91,708
22,201
113
You didn't correct it. I did.
You called me on it, I admitted I was wrong and never made the same claim again, that's correcting.
Still making the same example #1 Dunning-Kruger type mistake.


If that's true, then you will acknowledge that the following statement -- which has been repeated several times in various ways and which you have never corrected -- is erroneous.

We did not bet on a year to year change from 2014.
Let's see the proof that you have actually studied these matters. Acknowledge that your quoted statement is false and that you can apply the year-over-year increase from the original bet to NASA's current graph.
We can move on and call this one example #2 of your Dunning Kruger, I'd be glad to tackle this one with you.
Lets look at the evidence:
Therefore, the bet is from 1995 to 2015 -- you won't have to wait, as we'll know the winner by early 2016.

Do we have a bet?
That's a clear statement by you admitting the bet was 1995-2014.
Are you going to start by claiming that statement was wrong?

How about this one?
You posted a graph that showed a 0.43ºC anomaly for 1995 and we agreed to bet on whether there would be a minimum increase of 0.4ºC over 20 years.

So we bet on the remaining distance from the original 1995 anomaly of 0.43ºC.
You can't do a 20 year bet that starts in 2014 and ends in 2015, can you?

And this quote?
The bet was based on the IPCC's predictions of temperature increases of 0.2ºC per decade, not numerical changes produced retroactively through changes in methodology.
Again, you can't make a bet about decadal increases from 2014-2015, can you?

And one more, from just before we shook electronic hands on the bet:
The IPCC report was released in 1995. The only way to make it fair and to avoid any concerns about "cherry picking" is to use 1995 as the starting date.

Otherwise, I might be more inclined to pick 1997 or 1998 as the starting dates.

But we can't cherry pick. The only way to make it fair is to pick 1995 as the starting date.

Do we have a bet?

You repeatedly stated that the bet was 1995-2014, your first claim that about including 2014 didn't come until around December when you were losing the bet and needed a bigger cheat. The evidence is clear, the bet was on the 1995-2015 dates.
 

Moviefan-2

Court Jester
Oct 17, 2011
10,489
171
63
You can't do a 20 year bet that starts in 2014 and ends in 2015, can you?
You can take the first 19 years' worth of results and determine that the remaining difference is the increase needed to fulfill the bet.

We made the bet in 2015, not 1995. We already knew the results for the first 19 years at the time of the bet.

It's exactly as I said -- you haven't learned a damn thing.

(By the way, the Earth only has one annual average temperature. Using one baseline for your anomalies, you must get the same number using either 1995 or 2014 as your starting point if you're applying the math correctly).
 

Frankfooter

dangling member
Apr 10, 2015
91,708
22,201
113
You can take the first 19 years' worth of results and determine that the remaining difference is the increase needed to fulfill the bet.

We made the bet in 2015, not 1995. We already knew the results for the first 19 years at the time of the bet.

It's exactly as I said -- you haven't learned a damn thing.
The bet was based on a 20 year term as you clearly noted above and we used only the number from 1995 to calculate the number for 2015 that we bet on.
What is clear from those quotes is that we calculated the number we made the bet ONLY with 1995's reported anomaly at the time and the IPCC's projection of 0.2ºC per decade, not 2014.


(By the way, the Earth only has one annual average temperature. Using one baseline for your anomalies, you must get the same number using either 1995 or 2014 as your starting point if you're applying the math correctly).
This is a prime Dunning-Kruger statement. It makes no mathematical sense and has no relevance to the bet.

Explain why you think:
a) the temperature change from 1995-2015 has to equal the temperature change from 2014-2015
b) what quotes do you have that confirm that was part of the bet and that I ever agreed to such terms
 

Moviefan-2

Court Jester
Oct 17, 2011
10,489
171
63
Explain why you think:
a) the temperature change from 1995-2015 has to equal the temperature change from 2014-2015
Because the Earth can only have one annual average temperature for a particular year. The calculation of the anomaly for that year can only be one number, regardless of what year you use as your starting point.

You want to talk about a "prime Dunning-Kruger statement." The fact that you don't understand that the Earth can only have one average temperature in a given year proves that you don't know what you're talking about.

I genuinely don't believe you ever made it as far as high school. Kids in elementary school could figure this out:

Little Franky made a bet that the Earth's temperature at the end of 2015 would be 0.40ºC higher than it was in 1995.

At the time of the bet (May 2015), the Earth's temperature was 0.25ºC higher than 1995.

Question: How much more would the Earth's temperature have to increase for Little Franky to win the bet?

If little kids can solve this, you should be able to do it.

(And I don't need to find a quote that shows that you "agreed" that the difference between 0.25 and 0.40 is 0.15. That is a statement of fact -- it doesn't require your consent.)
 

Frankfooter

dangling member
Apr 10, 2015
91,708
22,201
113
Because the Earth can only have one annual average temperature for a particular year. The calculation of the anomaly for that year can only be one number, regardless of what year you use as your starting point.

You want to talk about a "prime Dunning-Kruger statement." The fact that you don't understand that the Earth can only have one average temperature in a given year proves that you don't know what you're talking about.
Now, while objectively you can argue that the Earth can only have one annual average temperature, practically we have issues with that statement. Measuring the planet's average temperature is an incredibly difficult task, measuring surface temperatures around the world, estimating surface temperatures between stations, accounting for differing measuring methods, adding in sea temperatures and measurements from different methods and then figuring out a formula that weights all of those metrics carefully to give us the best estimates possible. That's why NASA, NOAA, the Met Office and Japan all give us slightly different numbers each year. Those numbers are an approximation using a process that is continually being refined and updated, as one should expect scientists to do.

So that statement itself shows a Dunning-Kruger type over confident claim that is not supported by reality, since clearly there are at least 4 different numbers available, NASA, NOAA, Met Office and Japan's.


Little Franky made a bet that the Earth's temperature at the end of 2015 would be 0.40ºC higher than it was in 1995.
Correct, at the time NASA reported 1995's anomaly as 0.43ºC, so we added that and the 0.40ºC projection to bet that 2015 would hit 0.83ºC.

At the time of the bet (May 2015), the Earth's temperature was 0.25ºC higher than 1995.
Not correct.
We made the bet on May 10, 2015.
On May 15 you noted that the reported temp for 2015 to date was 0.79º.
The first four months of this year have been warm, but only 0.02 degrees higher than where we were at this time in 2010 (NASA's numbers show the average so far at 0.79, not 0.82. At this time in 2010, it was 0.77).

Question: How much more would the Earth's temperature have to increase for Little Franky to win the bet?
If little kids can solve this, you should be able to do it.
0.04ºC, your Dunning Kruger effect let you take the bet. You were overconfident to the point that you hadn't checked the year to date's temperatures and hadn't checked the global situation so you didn't notice that we were also at the start of a large El Nino. Instead you fixated on the difference between 2014's temperature and the bet, which needed a record year over year increase for me to win. But were you not suffering from Dunning Kruger you would have checked and found that we were already almost there.


Time for a quick recap.

In the Nobel thread you claimed you knew more about the results of a paper then one of its authors, Dunning Kruger example #1.
In this thread I challenged you with your 'greatest hits' list and your top choice or accusation came out as Dunning Kruger example #2.
And here, your Dunning Kruger has given us an excellent example #3.
 

Moviefan-2

Court Jester
Oct 17, 2011
10,489
171
63
That's why NASA, NOAA, the Met Office and Japan all give us slightly different numbers each year. Those numbers are an approximation using a process that is continually being refined and updated, as one should expect scientists to do.
LOL. The bullshitter is copying and pasting things he doesn't understand.

Sure, they give us an approximation ... but each only gives us one approximation. For example, NASA (in its current graph) said the temperature anomaly was 0.87ºC.

Similarly, when you estimate the number that would have been achieved if the IPCC's prediction had been correct, you can only have one number -- not one number starting from 1995 and a different number starting from 2014.

Your explanation is total bullshit. The actual reason your calculations don't add up to the same number is because your math is flawed.
 

Moviefan-2

Court Jester
Oct 17, 2011
10,489
171
63
On May 15 you noted that the reported temp for 2015 to date was 0.79º.
And speaking of flawed math .... :biggrin1:

The 0.25ºC increase was the difference between the temperature anomaly for 1995 (0.43ºC) and the temperature anomaly for 2014, on the graph that you posted (0.68ºC).

Here is what I actually said about the temperature anomaly for 2014 in the quote you lifted your sentence from.

The GISS 12-month average at the end of 2014 was an anomaly of 0.68 degrees.


The increase was from 0.43ºC to 0.68ºC -- a difference of 0.25ºC (I can't believe that I actually have to explain that to you.)

Let's try this again. So that Franky understands how to compare annual anomalies with annual anomalies, I'll spell it out for him.

----

A child can figure this out ... let's see if Frankfooter can do it.

Little Franky made a bet that the Earth's temperature at the end of 2015 would be 0.40ºC higher than it was in 1995.

At the time of the bet (May 2015), the Earth's temperature anomaly for the year 2014 was 0.25ºC higher than it was in 1995.

Question: How much more would the Earth's temperature have to increase in 2015 for Little Franky to win the bet?
 

Moviefan-2

Court Jester
Oct 17, 2011
10,489
171
63
Instead you fixated on the difference between 2014's temperature and the bet, which needed a record year over year increase for me to win.
Indeed.

And just how much of a year-over-year increase from 2014 was "needed" for you to win? :thumb:


Frankfooter

dangling member
Apr 10, 2015
91,708
22,201
113
And speaking of flawed math .... :biggrin1:

The 0.25ºC increase was the difference between the temperature anomaly for 1995 (0.43ºC) and the temperature anomaly for 2014, on the graph that you posted (0.68ºC).
You are still working with the wrong number for your claim:
At the time of the bet (May 2015), the Earth's temperature was 0.25ºC higher than 1995.
At the time of the bet, the 2015 year to date anomaly was 0.79ºC.
That's another basic, Dunning-Kruger type error.

And in total Dunning-Kruger fashion, you failed to make a case why 2014's temperature matters and whether or not we agreed to year of year terms (hint - we didn't).
All you did was go of an a series of non sequiturs that really have nothing to do with the terms we agreed to for the bet.

For instance, why does this statement matter to our bet, since you've clearly stated our bet was based on 1995-2015?
The GISS 12-month average at the end of 2014 was an anomaly of 0.68 degrees.
You failed to answer these two basic questions:
a) Why do you think that the temperature change from 1995-2015 has to equal the temperature change from 2014-2015?
b) What quotes do you have that confirm that was part of the bet and that I ever agreed to such terms?

I'll give you another chance, but this is just about set as Dunning-Kruger example #3 for you.
 
Ashley Madison
Toronto Escorts