The Porn Dude
Toronto Escorts

October Smashes Temperature Records Practically Guaranteeing 2015 Will Be HottestYear

Moviefan-2

Court Jester
Oct 17, 2011
10,489
171
63
You guys need an objective referee. Tell me the exact parameters of the bet and I'll act as your ref.

I'll try to be as honest and neutral as I can
I appreciate the offer but I'm going to decline.

When you see everything that has led to this point, you'll understand why. For now, think of my response as an early Christmas present.
 

Moviefan-2

Court Jester
Oct 17, 2011
10,489
171
63
Its you that keeps waffling here, I've said lets settle right now repeatedly.
What's keeping you?

cluck, cluck, little chicken.
There's no waffling. We'll settle up.

I don't have time to work on the analysis today or tomorrow. I'll post the final results this weekend.
 

Just looking

Member
May 24, 2010
539
11
18
October Smashes Temperature Records, Practically Guaranteeing 2015 Will Be Hottest Year Ever

November 18, 2015 by Josh L Davis

The climate records just keep rolling in. Month after month, we keep hitting above-average temperatures, setting new records that are only to be broken yet again further down the line. This October, however, has blasted all**others out of the water. Not only will it pretty much guarantee, with a 99.9 percent probability, that 2015 will be the world’s hottest year ever recorded, but**it was also the first month**to exceed NASA’s average temperature data by more than 1°C (nearly 2°F).

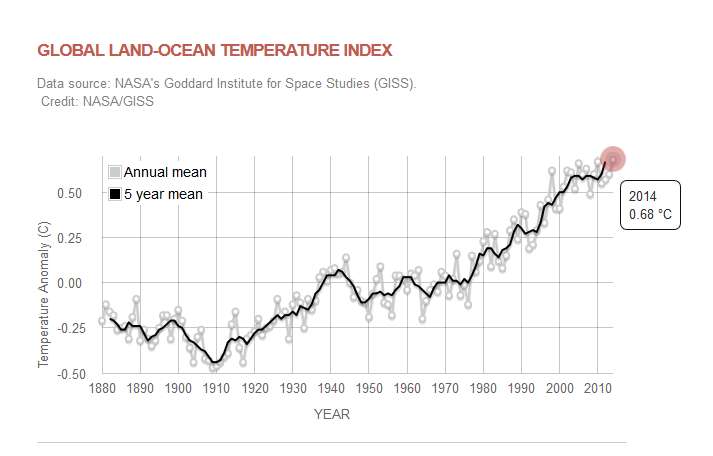
Rather than using pre-industrial levels as a baseline, NASA used an average from between 1951 and 1980 as their starting point, which already includes a certain degree of global warming. Even so, this October smashed that average. In fact, it was so hot, it goes down as the warmest monthever recorded in NASA’s**entire database. This basically makes certain the prediction that 2015 will see average global temperatures breach 1°C of warming since pre-industrial levels.


According to NASA’s data, the global average temperature for October of this year was a shocking 0.2°C (0.36°F) warmer than for the same period last year. All this warming has meant that the last time the world saw a record cold year was in 911. Unfortunately,**13 out of the 15 hottest years on record have all happened since the year 2000. It now seems that rather than slowing down, we’re instead driving full steam ahead to the point at which the planet will no longer be able to recover.

The reason behind these records is depressingly familiar, mainly being down to human-driven climate change. Increases in greenhouse gas emissions are clearly having the predicted effect of warming not just land temperatures, but also the oceans too. Things haven’t been helped by one of the worst El Nino events in recorded history.According to the**World Meteorological Organization, El Nino still has yet to reach its peak, which should be happening over the next few months and could see weather patterns change even more dramatically.

All these records are likely to precede another that the planet will hit next year. It looks likely that atmospheric concentrations of carbon dioxide are going to rise above 400 parts per million, and will probably stay that way for our lifetime, taking decades to start falling again. This not only contributes to the slow cooking of the planet, but also to ocean acidification, preventing molluscs from building their shells. Such temperatures also contribute to the global coral bleaching event currently in progress from Hawaii to the Caribbean.


http://www.iflscience.com/environment/october-smashes-temperature-records-practically-guaranteeing-2015-will-be-hottest-year
Very scary, Last winter was the worst I have seen in years, yet this year no snow as yet.

I worry about our children and the future.
 

Frankfooter

dangling member
Apr 10, 2015
84,426
19,214
113
There's no waffling. We'll settle up.

I don't have time to work on the analysis today or tomorrow. I'll post the final results this weekend.
Let me help you.
The analysis is quite easy.

A refresher on the bet:
If that's the chart you're saying will hit 0.83 at the end of 2015, we definitely have a bet.

The numbers are here:
http://data.giss.nasa.gov/gistemp/tabledata_v3/GLB.Ts+dSST.txt

2015 81 87 90 73 78 77 73 77 82 106 105
Year Jan Feb Mar Apr May Jun Jul Aug Sep Oct Nov


Add those numbers then divide by the 11 months we've records for.

That puts the year's anomaly at:
0.84ºC


This needs no 'analysis'.
That was the bet.
Those are the numbers.

I'll prep the books that you will have to buy and review here on this board as proof that you paid up over the weekend.
 

Moviefan-2

Court Jester
Oct 17, 2011
10,489
171
63
On the weekend, I will show that Franky not only lost the bet, he lost the argument.

And rather than just relying on my interpretation, I will cite some of Franky's own quotes to show that he agrees with my points.
 

eznutz

Active member
Jul 17, 2007
2,394
0
36
very interesting...

The study is authored by Anthony Watts and Evan Jones of surfacestations.org , John Nielsen-Gammon of Texas A&M , John R. Christy of the University of Alabama, Huntsville and represents years of work in studying the quality of the temperature measurement system of the United States.

Lead author Anthony Watts said of the study: “The majority of weather stations used by NOAA to detect climate change temperature signal have been compromised by encroachment of artificial surfaces like concrete, asphalt, and heat sources like air conditioner exhausts. This study demonstrates conclusively that this issue affects temperature trend and that NOAA’s methods are not correcting for this problem, resulting in an inflated temperature trend. It suggests that the trend for U.S. temperature will need to be corrected.” He added: “We also see evidence of this same sort of siting problem around the world at many other official weather stations, suggesting that the same upward bias on trend also manifests itself in the global temperature record”.
http://wattsupwiththat.com/2015/12/...tation-siting-matters-for-temperature-trends/
 

Frankfooter

dangling member
Apr 10, 2015
84,426
19,214
113
On the weekend, I will show that Franky not only lost the bet, he lost the argument.

And rather than just relying on my interpretation, I will cite some of Franky's own quotes to show that he agrees with my points.
You lost the bet.
Now you're just looking for ways to weasel out of it.
 

Moviefan-2

Court Jester
Oct 17, 2011
10,489
171
63
You lost the bet.
Now you're just looking for ways to weasel out of it.
Au contraire.

The now-famous wager of May 11, 2015:

We might get a bet, once you agree to use one chart for recording the results.

For example, your NASA chart that shows 1995 at 0.43 degrees Celsius put 2014 at 0.68 degrees in 2014: http://climate.nasa.gov/vital-signs/global-temperature/

If that's the chart you're saying will hit 0.83 at the end of 2015, we definitely have a bet.
Ok bets on.
Using that NASA figure of 0.43ºC anomaly for 1995 and waiting for the 2015 NASA anomaly figures to come out.
You've got an enormous problem on your hands, Franky.

I took a look at the link you posted: http://data.giss.nasa.gov/gistemp/tabledata_v3/GLB.Ts+dSST.txt

It doesn't show a temperature anomaly of 0.68ºC in 2014. More important, it doesn't show a temperature anomaly of 0.43ºC in 1995.

It looks like it's the wrong data set -- definitely not the one we bet on.

Perhaps you could explain this discrepancy. :thumb:
 

Frankfooter

dangling member
Apr 10, 2015
84,426
19,214
113
You've got an enormous problem on your hands, Franky.
:
No, you're the one with the problem.
As you noted in your quote above this is the bet:
If that's the chart you're saying will hit 0.83 at the end of 2015, we definitely have a bet.


And you also correctly noted the link to the data from NASA.
http://data.giss.nasa.gov/gistemp/tabledata_v3/GLB.Ts+dSST.txt

The bet was on whether the years global anomaly would hit 0.83ºC in 2015.

That was the bet, all else is just your whining because you've lost.
I will pick the books for you to read this weekend and I will let you wait until boxing day to buy them.

You lost the bet, time to pay up.
 

Frankfooter

dangling member
Apr 10, 2015
84,426
19,214
113
It doesn't show a temperature anomaly of 0.68ºC in 2014. More important, it doesn't show a temperature anomaly of 0.43ºC in 1995.
Yes, its a good thing we didn't bet on whether NASA would update their previous data, isn't it.
I might have lost that bet, but we only bet on what the year's anomaly would be.
 

Moviefan-2

Court Jester
Oct 17, 2011
10,489
171
63
I might have lost that bet, but we only bet on what the year's anomaly would be.
Actually, the bet was much more specific than that.

We bet on what the year's anomaly would be on the graph that shows a 0.43ºC anomaly for 1995. And we both agreed that the graph with the 0.43ºC anomaly for 1995 and a 0.68ºC anomaly for 2014 would be the only graph that can be used.

We might get a bet, once you agree to use one chart for recording the results.

For example, your NASA chart that shows 1995 at 0.43 degrees Celsius put 2014 at 0.68 degrees in 2014: http://climate.nasa.gov/vital-signs/global-temperature/

If that's the chart you're saying will hit 0.83 at the end of 2015, we definitely have a bet.
Ok bets on.
Using that NASA figure of 0.43ºC anomaly for 1995 and waiting for the 2015 NASA anomaly figures to come out.
This just keeps getting worse.

Not only does the table you posted not show a 0.43ºC anomaly for 2015, it doesn't even show a 0.4ºC increase from 1995 to 2015.

I bet Moviefan that the IPCC's projections would be accurate over a 20 year period. He waffled around and finally agreed to use 1995 as the start year, which was reported at 0.43ºC global anomaly by NASA. So we bet on whether or not the IPCC's 0.2ºC increase per decade would be accurate or whether the global anomaly would hit 0.83ºC for 2015 (0.43ºC plus 0.4º increase).
Franky, you've obviously got the wrong data set.

We need to sort this out in order to determine who won the bet.
 

Moviefan-2

Court Jester
Oct 17, 2011
10,489
171
63
Franky:

Maybe this will help jog your memory -- it's the actual graph we used as the basis for the bet.


Let us know how the search is going for the correct data.
 

Frankfooter

dangling member
Apr 10, 2015
84,426
19,214
113
Franky:

Maybe this will help jog your memory -- it's the actual graph we used as the basis for the bet.
That is the chart we used to calculate the number we bet on for 2015.
We didn't bet on what that chart would say for 1995 in 2015, we bet on what that chart would give us as a reading for 2015.

You lost the bet.
Time to pay up.
 

Frankfooter

dangling member
Apr 10, 2015
84,426
19,214
113
Actually, the bet was much more specific than that.

We bet on what the year's anomaly would be .
That was the bet.
We bet on whether 2015's global anomaly would hit 0.83ºC by NASA's readings.
It did.

You lost the bet.
Time to pay up.
 

Moviefan-2

Court Jester
Oct 17, 2011
10,489
171
63
...we bet on what that chart would give us as a reading for 2015.
Exactly.

And the bet was clear that it had to be that chart -- the one posted above with the 0.68ºC anomaly for 2014 -- that we used for the 2015 anomaly. And no other chart.

Unfortunately for you, you've been citing the wrong data set from the wrong graph. The data set you posted shows the anomaly for 2014 at 0.74ºC, not 0.68ºC.

It's not "that chart," the one we both agreed we would use to settle the bet.

We also agreed that we would only use "one chart for recording the results," not a 1995 anomaly from one graph and a 2015 anomaly from an entirely different graph.

We might get a bet, once you agree to use one chart for recording the results.

For example, your NASA chart that shows 1995 at 0.43 degrees Celsius put 2014 at 0.68 degrees in 2014: http://climate.nasa.gov/vital-signs/global-temperature/

If that's the chart you're saying will hit 0.83 at the end of 2015, we definitely have a bet.
Ok bets on.
Using that NASA figure of 0.43ºC anomaly for 1995 and waiting for the 2015 NASA anomaly figures to come out.
I set very specific terms because I know how you to love mix and match different data sets to create fairy-tale conclusions.

The bet was clear and it was that we would only use one graph, the one cited above. And you agreed to it.

The official results will be posted tomorrow. You're in big trouble, Franky.
 

Frankfooter

dangling member
Apr 10, 2015
84,426
19,214
113
The bet was clear and it was that we would only use one graph, the one cited above. And you agreed to it.

The official results will be posted tomorrow. You're in big trouble, Franky.
Yes, we would use NASA's dataset as the source for our bet on whether 2015's global anomaly would hit 0.83ºC.
That was the number we bet on.
We hit that number in November.
http://data.giss.nasa.gov/gistemp/tabledata_v3/GLB.Ts+dSST.txt

NASA says the year to date is now 0.84ºC.

You lost the bet.
Time to pay up.
Stop whining.
 

Moviefan-2

Court Jester
Oct 17, 2011
10,489
171
63
Yes, we would use NASA's dataset as the source for our bet on whether 2015's global anomaly would hit 0.83ºC.
No, we didn't say "NASA's dataset."

The bet was much more specific. It was whether the "NASA chart that shows 1995 at 0.43ºC degrees Celsius...will hit 0.83 at the end of 2015."

https://terb.cc/vbulletin/showthread.php?p=5243530#post5243530

It was specific to the graph with the 0.43ºC anomaly in 1995 and the 0.68ºC anomaly in 2014 -- not to any NASA graph that suits your fancy.

Remember this sentence in the terms of the bet: "We might get a bet, once you agree to use one chart for recording the results."

The terms were explicit. The same graph has to show the 0.43ºC anomaly for 1995 and the number for the 2015 anomaly. It is a violation of the terms of the bet to take the 1995 anomaly from one graph and a 2015 anomaly from a different graph.

You agreed to those terms. And you pledged to honour them.

Let's review your history:

- You threw a temper tantrum last year after you lost the first bet about whether I could name three climate researchers at recognized public institutions who don't support the IPCC. In that case, you claimed it was unfair because you hadn't actually read the terms of the bet.

- You welched on the second bet on the IPCC's 2007 prediction by pretending that "Frankfooter" and "Groggy" are different people.

I'm content to honour the bet as we made it.
The official results will be posted tomorrow.

For once, I expect you to behave like an adult and honour your commitments, as you pledged you would.
 
Ashley Madison
Toronto Escorts