Steeles Royal

October Smashes Temperature Records Practically Guaranteeing 2015 Will Be HottestYear

Frankfooter

dangling member
Apr 10, 2015
91,708
22,201
113
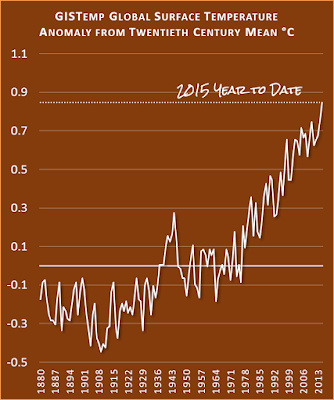
That's about all it is,...unless somebody can post a report of the results of re-writing history,...sorry,..."re-calibration",...

Was the result higher or lower,...nothing more needs to be said,...until then,...useless,...!!!


FAST
Why do you think you're opinion should be valid in this debate when you can't even read a chart, even after its been explained to you?
Are you really that daft?
 

Frankfooter

dangling member
Apr 10, 2015
91,708
22,201
113
This message brought to you by the Harper government, shutting up scientists all across Canada.

Seriously, that's just more shite that Harper tried to pass off as fact, yet one more reason why he wouldn't let our scientists speak publicly, except PMO talking points.
Canada, Russia and Brazil hold 65% of the world's forests.
And:
The largest areas of IFL degradation are found in the Northern boreal forest belt of Canada, Russia and Alaska (47 percent) and tropical forest regions such as the Amazon (25 percent) and Congo (9 percent) basins.
Most of the world’s largest intact landscapes – that is, forest landscapes that exceed 10 million hectares – have remained intact; it is the small- and medium-sized IFLs that are declining.
The countries with the highest degradation proportional to their initial area in 2000 are Paraguay, Australia, Bolivia, Myanmar and Gabon.
The countries with the highest total area of degradation since 2000 are Canada, Russia, Brazil, the United States and Bolivia.
http://blog.globalforestwatch.org/2...maining-pristine-forests-since-2000/#more-718

Apparently we cut down 104 million hectares of forest since 2000.
http://intactforests.org/
 

Frankfooter

dangling member
Apr 10, 2015
91,708
22,201
113
They're not actually close, at all.

And when the huge El Nino ends? The predictions will only get that much worse.
We'll see if we need start a new bet after you lose this one.
0.005% away from you having to admit that the IPCC projections are spectacularly accurate.
 

Moviefan-2

Court Jester
Oct 17, 2011
10,489
171
63
Why do you think you're opinion should be valid in this debate when you can't even read a chart, even after its been explained to you?
I love it. Franky says we shouldn't pay attention to the opinions of someone who can't read a chart. :thumb:

Let's take a look at his recent record.

Nov. 10 -- He calculated that the "pre-industrial age" refers to the year 1990: https://terb.cc/vbulletin/showthrea...armer-Planet&p=5394609&viewfull=1#post5394609. He repeated that claim on Nov. 21: https://terb.cc/vbulletin/showthrea...ing-Point%92&p=5404144&viewfull=1#post5404144

Nov. 20 -- He claimed it was "conspiracy thread business" to assert that NASA's pre-adjusted data showed there wasn't a single month in 2015 that was a record breaker (https://terb.cc/vbulletin/showthrea...-HottestYear&p=5403467&viewfull=1#post5403467). He spent an entire weekend making that argument until he was finally forced to concede that I was right.

Nov. 29 -- He said the current HadCRUT anomaly for the year 2015 is 0.79ºC: https://terb.cc/vbulletin/showthrea...imate-Change&p=5411834&viewfull=1#post5411834. It is actually 0.71ºC.

Nov. 29 -- This one is my favourite. He said NASA and NOAA don't use sea surface temperatures in their calculations of the global temperature anomalies: https://terb.cc/vbulletin/showthrea...imate-Change&p=5411862&viewfull=1#post5411862. Apparently, he doesn't know what SST stands for. :D

Talk about someone who can't even read a chart.
 

AK-47

Armed to the tits
Mar 6, 2009
6,697
1
0
In the 6

basketcase

Well-known member
Dec 29, 2005
61,454
6,700
113
And yet you're forgetting about the treeline, which keep moving North. We are probably adding just as many trees as we are cutting down:

http://www.reuters.com/article/2011/05/13/us-arctic-green-idUSTRE74B7B020110513#j3G8FyM2iQp2jv2b.97
Too bad nature isn't a rapid process; it will be an extremely lengthy process for permafrost to melt, small scale plant life to slowly move in and then provide suitable nutrient bed as a basis for large trees to grow. Even then it will be stunted conifers growing there which have much less capacity to create oxygen than deciduous and jungle growth.

And oh yeah, there is another problem - it's called sunlight, something that is not abundant up north.
 

basketcase

Well-known member
Dec 29, 2005
61,454
6,700
113

Moviefan-2

Court Jester
Oct 17, 2011
10,489
171
63
Why don't your hadcrut numbers support that claim? According to their numbers, last year was the warmest year of the 165 years they list and this year to date is blowing last year away (and is way higher than any of the other el Nino years).
Now, try comparing the numbers to what the IPCC predicted. You'll see the temperature anomalies, even in this huge El Nino year, are nowhere near what the IPCC predicted.

Don't take my word for it. Frankfooter's graph -- the one he has repeatedly posted -- confirms the same point.

In fact, according to Franky's graph, there hasn't been a single year in the 21st century where the temperature anomaly aligns with what the IPCC predicted.

http://1.bp.blogspot.com/-rRPfFl2DQ...an+surface+temperature+hadcrut4+and+model.png

The IPCC's predictions continue to be spectacularly wrong.
 

basketcase

Well-known member
Dec 29, 2005
61,454
6,700
113
Now, try comparing the numbers to what the IPCC predicted. You'll see the temperature anomalies, even in this huge El Nino year, are nowhere near what the IPCC predicted.

Don't take my word for it. Frankfooter's graph -- the one he has repeatedly posted -- confirms the same point.

In fact, according to Franky's graph, there hasn't been a single year in the 21st century where the temperature anomaly aligns with what the IPCC predicted.

http://1.bp.blogspot.com/-rRPfFl2DQ...an+surface+temperature+hadcrut4+and+model.png

The IPCC's predictions continue to be spectacularly wrong.
I sure won't take your word for it since you have repeatedly posted sources that disagree with your point. I especially laugh because you have kept claiming there has been no rise in temperature this century while the graph you mention clearly shows there is.

And you keep posting this graph as "proof"
http://www.science-skeptical.de/wp-content/uploads/2012/12/Entwurf3.jpg
Meanwhile the hadcrut data for the past few years has been:
2012 - 0.470
2013 - 0.499
2014 - 0.567
2015 (10 of 12 months) - 0.713

Strangely despite your claims all of those data points fit well within the projections.
 

FAST

Banned
Mar 12, 2004
10,069
1
0
Why do you think you're opinion should be valid in this debate when you can't even read a chart, even after its been explained to you?
Are you really that daft?
I did NOT state my opinion,...I asked a question,...that you obviously can't answer,...about a chart YOU provided.

Once again,...what the is the result of the re-writing history,...sorry,..."re-calibrating",...???

Did the rewriting/calibrating increase the temps,...or decrease the temps from previous claims by the UNEMPLOYABLEs,...???

YOU obviously have NO clue,...do you.

FAST
 

Moviefan-2

Court Jester
Oct 17, 2011
10,489
171
63
I sure won't take your word for it since you have repeatedly posted sources that disagree with your point. I especially laugh because you have kept claiming there has been no rise in temperature this century while the graph you mention clearly shows there is.
Actually, I said temperatures have been stagnant in the 21st century, and Frankfooter's graph confirms it.

Apart from the El Nino increase in 2015 (which has nothing to do with anthropogenic global warming), the graph shows temperatures have been stagnant in the 21st century.
 

Moviefan-2

Court Jester
Oct 17, 2011
10,489
171
63
Meanwhile the hadcrut data for the past few years has been:
2012 - 0.470
2013 - 0.499
2014 - 0.567
2015 (10 of 12 months) - 0.713

Strangely despite your claims all of those data points fit well within the projections.
Since you insist on revisiting this, let's compare these numbers with what you posted back in July. You said the temperature anomalies on this particular graph were:

2013 - 0.6
2014 - 0.68

https://terb.cc/vbulletin/showthrea...ing-Point%92&p=5301206&viewfull=1#post5301206

Boy, were you ever wrong. That's because you didn't know that you can't mix and match numbers from completely different data sets. In other words, you don't know how to read a graph at even a Grade 10 level.

As for your latest claim that the 0.713 anomaly in this huge El Nino year is "well within" the predictions, Franky's graph shows the IPCC prediction for 2015 at about 0.85.

http://1.bp.blogspot.com/-rRPfFl2DQ...an+surface+temperature+hadcrut4+and+model.png

Last time I checked, 0.71 is well below 0.85. Where did you study math?
 

Frankfooter

dangling member
Apr 10, 2015
91,708
22,201
113
Since you insist on revisiting this, let's compare these numbers with what you posted back in July. You said the temperature anomalies on this particular graph were:
You are lying.

You are referencing a graph you linked to originally and claimed its an official IPCC chart, despite having been told multiple times that its not a published IPCC chart.
You need to stop being so dishonest and lying your face off so often.

That chart was a leaked chart that was never published.
https://informthepundits.wordpress.com/2013/10/01/ipcc-wg1-leaked-graph-conspiracy/

You've been told this multiple times, this isn't a mistake its a deliberate attempt at fraud.

This is the legit chart that the IPCC published.
 

basketcase

Well-known member
Dec 29, 2005
61,454
6,700
113
Actually, I said temperatures have been stagnant in the 21st century, and Frankfooter's graph confirms it.

Apart from the El Nino increase in 2015 (which has nothing to do with anthropogenic global warming), the graph shows temperatures have been stagnant in the 21st century.
You have an interesting definition of stagnant if it includes a continual warming trend.
 

basketcase

Well-known member
Dec 29, 2005
61,454
6,700
113
Since you insist on revisiting this, let's compare these numbers with what you posted back in July. You said the temperature anomalies on this particular graph were:

2013 - 0.6
2014 - 0.68
...
Wow. You show less than a shred of honesty in your desperate attempts to feign a different reality.

Even someone as dishonest as you would admit there are many different data sets out there. In the post you linked I clearly used the NASA data set. Of course you don't like what the NASA data shows so you ignore it. You keep posting the hadcrut data because you like the numbers what it says better.

BUT FACT IS, THE HADCRUT DATA FITS THE PROJECTIONS TOO
 

basketcase

Well-known member
Dec 29, 2005
61,454
6,700
113
It doesn't.

Prior to the strong El Nino this year, there were "flattening" temperatures in the 21st century, to use NASA's description.
Nice excuse. If you ignore all the parts that show a continuing warming trend, there's no warming. I think you've earned your PhD.


p.s. Both Nasa's data and the hadcrut data show the past several years are the warmest on record. It's not a matter of this el Nino.
 

Moviefan-2

Court Jester
Oct 17, 2011
10,489
171
63
Wow. You show less than a shred of honesty in your desperate attempts to feign a different reality.

Even someone as dishonest as you would admit there are many different data sets out there. In the post you linked I clearly used the NASA data set. Of course you don't like what the NASA data shows so you ignore it. You keep posting the hadcrut data because you like the numbers what it says better.
Yeah, I know it was NASA's data. But you applied it to a graph that was using the HadCRUT data, which has a completely different baseline, to create your fairy-tale claims about warming.

That's the point. You didn't know that you can't combine different numbers from completely different data sets.

What you did proves that you don't know how to read graphs. Period.

And, no, the HadCRUT anomalies do not align with the IPCC's predictions. Take another look at Franky's graph.
 
Ashley Madison
Toronto Escorts