


So what were the dominant factors for the increase between 1910 thru 1945,...???Yes, but until 1950 or so anthropogenic forcings weren't the dominant factors.
FAST
So what were the dominant factors for the increase between 1910 thru 1945,...???Yes, but until 1950 or so anthropogenic forcings weren't the dominant factors.
As much as I hate to get into this in yet another thread, that's not actually what the data show.Yah it's something like that, which makes the next few hundred years very scary. I won't be here but the data is there....

I hope you're right. In any event, nothing we do today will matter.Just to be clear, we are not doing anything nor will we. Rich nations (which emit most Co2) are not willing to become poorer to cool the planet.
That chart has two problems.As much as I hate to get into this in yet another thread, that's not actually what the data show.
The data show the "very scary" predictions have been spectacularly wrong. There is no evidence that the warming that occurred in the last two decades of the previous century was unprecedented or anthropogenic.
Cherry picking dates again?Here's a link to the latest HadCRUT numbers, which had been adjusted slightly since the graph that I posted had been produced:
http://www.cru.uea.ac.uk/cru/data/temperature/HadCRUT4.pdf
http://www.cru.uea.ac.uk/cru/data/temperature/
The adjustments don't matter, though.
Even with the adjustments, the anomaly for 2014 (about 0.57 degrees C) was statistically the same as 2005 and 2010 and nowhere near the 0.85 degrees C that what was predicted. Even with the El Nino increase this year, the global temperature so far in 2015 is nowhere near what was predicted.
HadCRUT most definitely uses a different baseline. It's the same baseline that was in the graph I cited.And at present, the global temp for 2015 is at 0.83ºC for NOAA, 0.80º for NASA (unless I reversed those, thats by memory) and 0.684ºC for CRU, which I believe uses a different baseline.
Quote Originally Posted by Frankfooter
Yes, but until 1950 or so anthropogenic forcings weren't the dominant factors.
You are hopeless.HadCRUT most definitely uses a different baseline. It's the same baseline that was in the graph I cited.
Therefore, we can dismiss your NOAA and NASA numbers in our comparison with the CMIP5 predictions, as the baselines are entirely different.
Comparing apples to apples, the 0.68 degrees C anomaly so far for 2015 -- brought about by El Nino -- is nowhere near the 0.85 degrees C prediction.
I've provided you with the sources before -- they can all be found at the bottom of the graph.Until you do, I'm calling bullshit on it, since its come through at least two iterations and is likely to be a decade or so older....

That chart isn't coming from the MET or the Post, though I traced it to a Post article.I've provided you with the sources before -- they can all be found at the bottom of the graph.
That's an older chart, sourced from a skeptical science article that exposes the chart as from a leaked draft from the IPCC.By the way, I can produce other graphs -- including graphs from the IPCC -- that confirm the IPCC's predictions were spectacularly wrong.
IPCC:
That's a faked chart, from your dodgy lobbyist Watt.University of Alabama in Huntsville:
Not until you can come up with a real chart, not the two faked charts you posted here.Now, it's Frankfooter's turn.
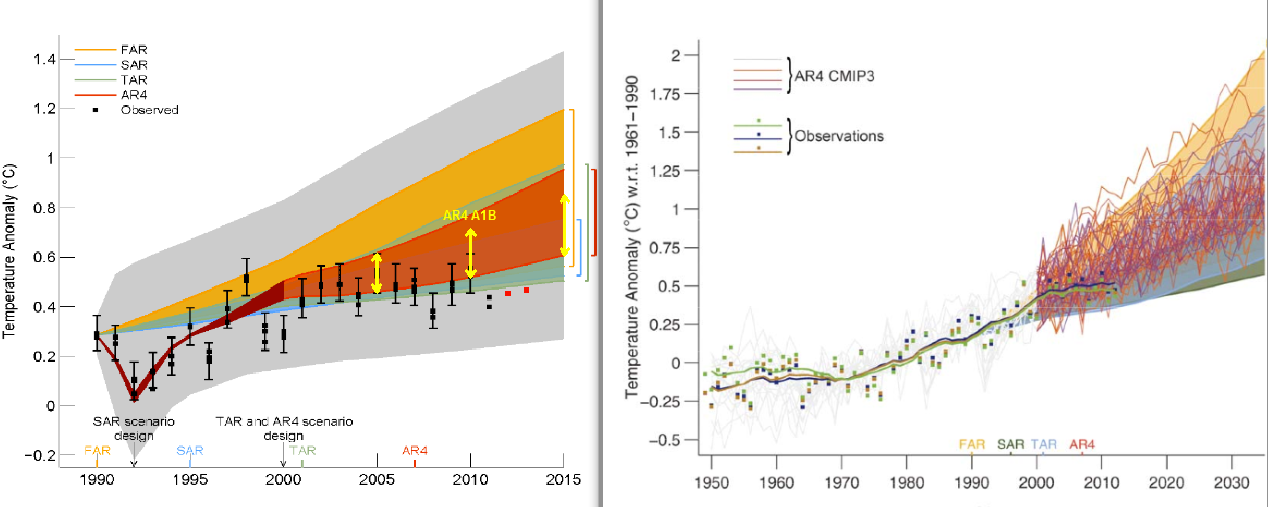
Produce a graph that compares current temperatures compare with the predictions.
Bullshit.And note that it even proves that the IPCC's predictions are right on the money in the chart on the right, since the 2015 temp of 0.83ºC is at the top of the red bar, and last year's 0.68ºC is smack dab in the middle.
Nonsense. The link to the image came from Watts but the chart itself was produced by the University of Alabama in Huntsville.That's a faked chart, from your dodgy lobbyist Watt.
It combines surface temp predictions with atmospheric readings, an out and out fake combing apples and oranges.
HadCRUT uses a different baseline, 1961-1990, if memory serves me correct.Bullshit.
The HadCRUT data being used in the graph put 2014 at 0.56 degrees C., right at the bottom of the graph. Even the 0.68 degrees temperature so far for this year -- an El Nino year -- is still far below the 0.85 prediction based on the CMIP-5 averages and still at the bottom portion of the graph.
You are making things up.In fact, your own NASA graph shows you're full of crap.
According to you, 2014 was 0.12 degrees C warmer than 2010. However, your NASA graph shows 2014 was only 0.03 degrees warmer than 2010.
I think its bullshit, as everything from Watts is.Nonsense. The link to the image came from Watts but the chart itself was produced by the University of Alabama in Huntsville.
More bullshit.HadCRUT uses a different baseline, 1961-1990, if memory serves me correct.
Comparing it to CMIP-5 projections is comparing apples to oranges.
Try again.
I'll deal with this one tomorrow. I can only handle so many of your lies in one evening.You are making things up.
I never said such a thing.
That is just yet another lie.
Do you ever stop lying?

