


With just a few weeks to go until the end of the year, Frankfooter and I have agreed to settle our May 11, 2015, bet on the legitimacy of the IPCC's predictions about man-made global warming.
Here are the official results. I tried to keep this as succinct as possible, but due to Frankfooter's ongoing foolishness and misrepresentations of reality, this analysis is longer than I would have liked.
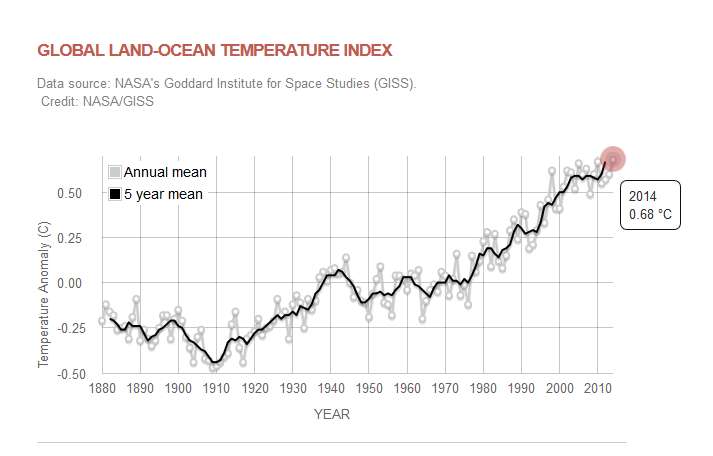
The bet was on the low end of various IPCC predictions. In this case, we chose the IPCC prediction that the planet would warm by 0.2ºC per decade. Frankfooter insisted we use a 20-year time frame (he needed to include some years from the 1990s, when warming actually occurred) and we agreed to use the following NASA graph to judge the results.
Here are the exact terms of the bet:
The terms were clear and Frankfooter agreed to them. We would use one graph for the results, and it had to be the graph above that showed a temperature anomaly of 0.43ºC in 1995 and 0.68ºC in 2014. The bet was that the final 2015 anomaly on that same graph wouldn't reach 0.83ºC.
Regrettably, NASA's reporting standards got rather shaky along the way. In July, NASA announced that it was switching to a completely different data set than the one we bet on, due to some controversial changes to the sea surface temperature records provided by the NOAA.
http://data.giss.nasa.gov/gistemp/updates_v3/ersst4vs3b/
http://data.giss.nasa.gov/gistemp/updates_v3/ersst4vs3b/v3b+v4_lrg.png
At that time, I proposed that we revise the bet to fit the new data. But Frankfooter wouldn't hear of it. Even though the graph we bet on wouldn't be updated beyond the numbers for May 2015, Frankfooter hurled insults at me and insisted: "The bet stands" (https://terb.cc/vbulletin/showthrea...ing-Point%92&p=5301216&viewfull=1#post5301216).
So, the bet stands. Let's look at the final results for 2015 on that graph.
Using NASA's final data from the pre-adjusted period and confirming the numbers via the blog posts by global warming enthusiast Greg Laden, we can confirm that the temperature anomalies for 2015 on the graph we bet on are:
http://bit.ly/1O6YPsX
- January: 0.75ºC (http://scienceblogs.com/gregladen/2015/02/16/so-how-warm-was-january/)
- February: 0.82ºC (Laden reported a lower number, but it was subsequently adjusted: http://scienceblogs.com/gregladen/2...y-warm-continues-upward-global-warming-trend/)
- March: 0.84ºC (http://scienceblogs.com/gregladen/2015/04/14/march-2015-was-a-very-warm-month/)
- April: 0.71ºC (http://scienceblogs.com/gregladen/2015/06/15/how-warm-was-may/)
- May: 0.71ºC (http://scienceblogs.com/gregladen/2015/06/15/how-warm-was-may/)
That works out to an average for the year of 0.766ºC -- well below 0.83ºC. According to the exact terms that Frankfooter insisted must "stand," Frankfooter lost the bet.
He has pledged that he will honour the decision to stick with those terms, foolish as it was.
That said, fair-minded people might question whether Frankfooter is being held to an unreasonable standard, even if it is due to his own blatant stupidity. After all, this is a super El Nino year, and some of the warmest months have been the final months of the year.
In fact, it doesn't matter.
As Frankfooter has noted, you can compare data from different data sets if you make the appropriate adjustments.
Indeed, when we take the 2015 anomaly on the graph that NASA is now using and make the correct adjustment so that it fits the original graph, Frankfooter still loses.
The current years on NASA's new graph have been adjusted upward by at least 0.055ºC. For example, NASA's reported anomaly for 2014 has gone from 0.68ºC to 0.74ºC.
Taking the current anomaly for 2015 on current data set (http://data.giss.nasa.gov/gistemp/tabledata_v3/GLB.Ts+dSST.txt) -- approximately 0.845ºC -- and subtracting 0.055ºC, you finish with an anomaly that's comparable to the original graph of about 0.79ºC for the year 2015 (to the end of November).
That's less than the 0.80ºC average for 2015 that existed when we made the bet back in May (NASA hadn't yet reported the April anomaly at the time of the bet).
If NASA's numbers are right (and that's a big "if"), the Earth is no warmer today than it was when we made the bet. And no matter how you calculate it, the anomaly in 2015 is well below the IPCC prediction of 0.2ºC per decade (even the current NASA graph shows a 2015 anomaly that is below the 0.4ºC mark over two decades).
Frankfooter has clearly lost the bet.
More significantly, he has lost the argument. Even in this super El Nino year, using the low end of IPCC predictions, the predictions have still come up short.
The IPCC's predictions have been spectacularly wrong, as I have said all along.
Here are the official results. I tried to keep this as succinct as possible, but due to Frankfooter's ongoing foolishness and misrepresentations of reality, this analysis is longer than I would have liked.
The bet was on the low end of various IPCC predictions. In this case, we chose the IPCC prediction that the planet would warm by 0.2ºC per decade. Frankfooter insisted we use a 20-year time frame (he needed to include some years from the 1990s, when warming actually occurred) and we agreed to use the following NASA graph to judge the results.
https://terb.cc/vbulletin/showthread.php?p=5425457#post5425457I bet Moviefan that the IPCC's projections would be accurate over a 20 year period. He waffled around and finally agreed to use 1995 as the start year, which was reported at 0.43ºC global anomaly by NASA. So we bet on whether or not the IPCC's 0.2ºC increase per decade would be accurate or whether the global anomaly would hit 0.83ºC for 2015 (0.43ºC plus 0.4º increase).
Here are the exact terms of the bet:
We might get a bet, once you agree to use one chart for recording the results.
For example, your NASA chart that shows 1995 at 0.43 degrees Celsius put 2014 at 0.68 degrees in 2014: http://climate.nasa.gov/vital-signs/global-temperature/
If that's the chart you're saying will hit 0.83 at the end of 2015, we definitely have a bet.
https://terb.cc/vbulletin/showthread.php?p=5243530#post5243530Ok bets on.
Using that NASA figure of 0.43ºC anomaly for 1995 and waiting for the 2015 NASA anomaly figures to come out.
The terms were clear and Frankfooter agreed to them. We would use one graph for the results, and it had to be the graph above that showed a temperature anomaly of 0.43ºC in 1995 and 0.68ºC in 2014. The bet was that the final 2015 anomaly on that same graph wouldn't reach 0.83ºC.
Regrettably, NASA's reporting standards got rather shaky along the way. In July, NASA announced that it was switching to a completely different data set than the one we bet on, due to some controversial changes to the sea surface temperature records provided by the NOAA.
http://data.giss.nasa.gov/gistemp/updates_v3/ersst4vs3b/
http://data.giss.nasa.gov/gistemp/updates_v3/ersst4vs3b/v3b+v4_lrg.png
At that time, I proposed that we revise the bet to fit the new data. But Frankfooter wouldn't hear of it. Even though the graph we bet on wouldn't be updated beyond the numbers for May 2015, Frankfooter hurled insults at me and insisted: "The bet stands" (https://terb.cc/vbulletin/showthrea...ing-Point%92&p=5301216&viewfull=1#post5301216).
So, the bet stands. Let's look at the final results for 2015 on that graph.
Using NASA's final data from the pre-adjusted period and confirming the numbers via the blog posts by global warming enthusiast Greg Laden, we can confirm that the temperature anomalies for 2015 on the graph we bet on are:
http://bit.ly/1O6YPsX
- January: 0.75ºC (http://scienceblogs.com/gregladen/2015/02/16/so-how-warm-was-january/)
- February: 0.82ºC (Laden reported a lower number, but it was subsequently adjusted: http://scienceblogs.com/gregladen/2...y-warm-continues-upward-global-warming-trend/)
- March: 0.84ºC (http://scienceblogs.com/gregladen/2015/04/14/march-2015-was-a-very-warm-month/)
- April: 0.71ºC (http://scienceblogs.com/gregladen/2015/06/15/how-warm-was-may/)
- May: 0.71ºC (http://scienceblogs.com/gregladen/2015/06/15/how-warm-was-may/)
That works out to an average for the year of 0.766ºC -- well below 0.83ºC. According to the exact terms that Frankfooter insisted must "stand," Frankfooter lost the bet.
He has pledged that he will honour the decision to stick with those terms, foolish as it was.
https://terb.cc/vbulletin/showthrea...lantic-Ocean&p=5365706&viewfull=1#post5365706I'm content to honour the bet as we made it.
That said, fair-minded people might question whether Frankfooter is being held to an unreasonable standard, even if it is due to his own blatant stupidity. After all, this is a super El Nino year, and some of the warmest months have been the final months of the year.
In fact, it doesn't matter.
As Frankfooter has noted, you can compare data from different data sets if you make the appropriate adjustments.
https://terb.cc/vbulletin/showthrea...-HottestYear&p=5413209&viewfull=1#post5413209You can quite clearly use data from different sources if you adjust for the different baselines.
Indeed, when we take the 2015 anomaly on the graph that NASA is now using and make the correct adjustment so that it fits the original graph, Frankfooter still loses.
The current years on NASA's new graph have been adjusted upward by at least 0.055ºC. For example, NASA's reported anomaly for 2014 has gone from 0.68ºC to 0.74ºC.
Taking the current anomaly for 2015 on current data set (http://data.giss.nasa.gov/gistemp/tabledata_v3/GLB.Ts+dSST.txt) -- approximately 0.845ºC -- and subtracting 0.055ºC, you finish with an anomaly that's comparable to the original graph of about 0.79ºC for the year 2015 (to the end of November).
That's less than the 0.80ºC average for 2015 that existed when we made the bet back in May (NASA hadn't yet reported the April anomaly at the time of the bet).
If NASA's numbers are right (and that's a big "if"), the Earth is no warmer today than it was when we made the bet. And no matter how you calculate it, the anomaly in 2015 is well below the IPCC prediction of 0.2ºC per decade (even the current NASA graph shows a 2015 anomaly that is below the 0.4ºC mark over two decades).
Frankfooter has clearly lost the bet.
More significantly, he has lost the argument. Even in this super El Nino year, using the low end of IPCC predictions, the predictions have still come up short.
The IPCC's predictions have been spectacularly wrong, as I have said all along.
Last edited:

