Mapped: Which Countries Have the Highest Inflation?

Addict2sex

Well-known member
Jan 29, 2017
2,441
1,254
113

Mapped: Which Countries Have the Highest Inflation?

SUNDAY, DEC 11, 2022 - 09:55 AM
Inflation is surging nearly everywhere in 2022.
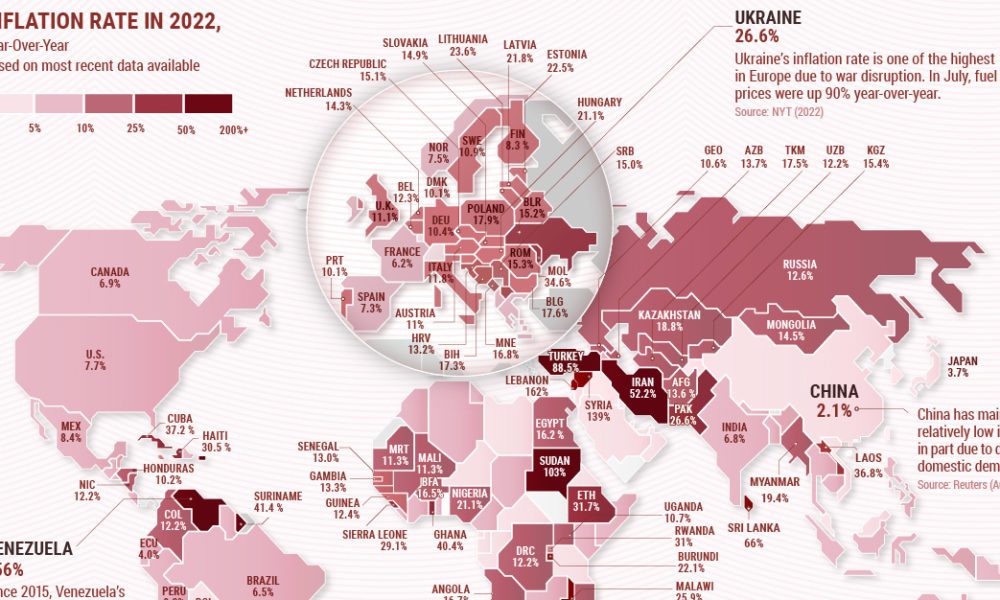
Geopolitical tensions are triggering high energy costs, while supply-side disruptions are also distorting consumer prices. The end result is that almost half of countries worldwide are seeing double-digit inflation rates or higher.
With new macroeconomic forces shaping the global economy, Visual Capitalist's Dorothy Nuefeld shows, in the infographic below, countries with the highest inflation rates, using data from Trading Economics.


Double-Digit Inflation in 2022
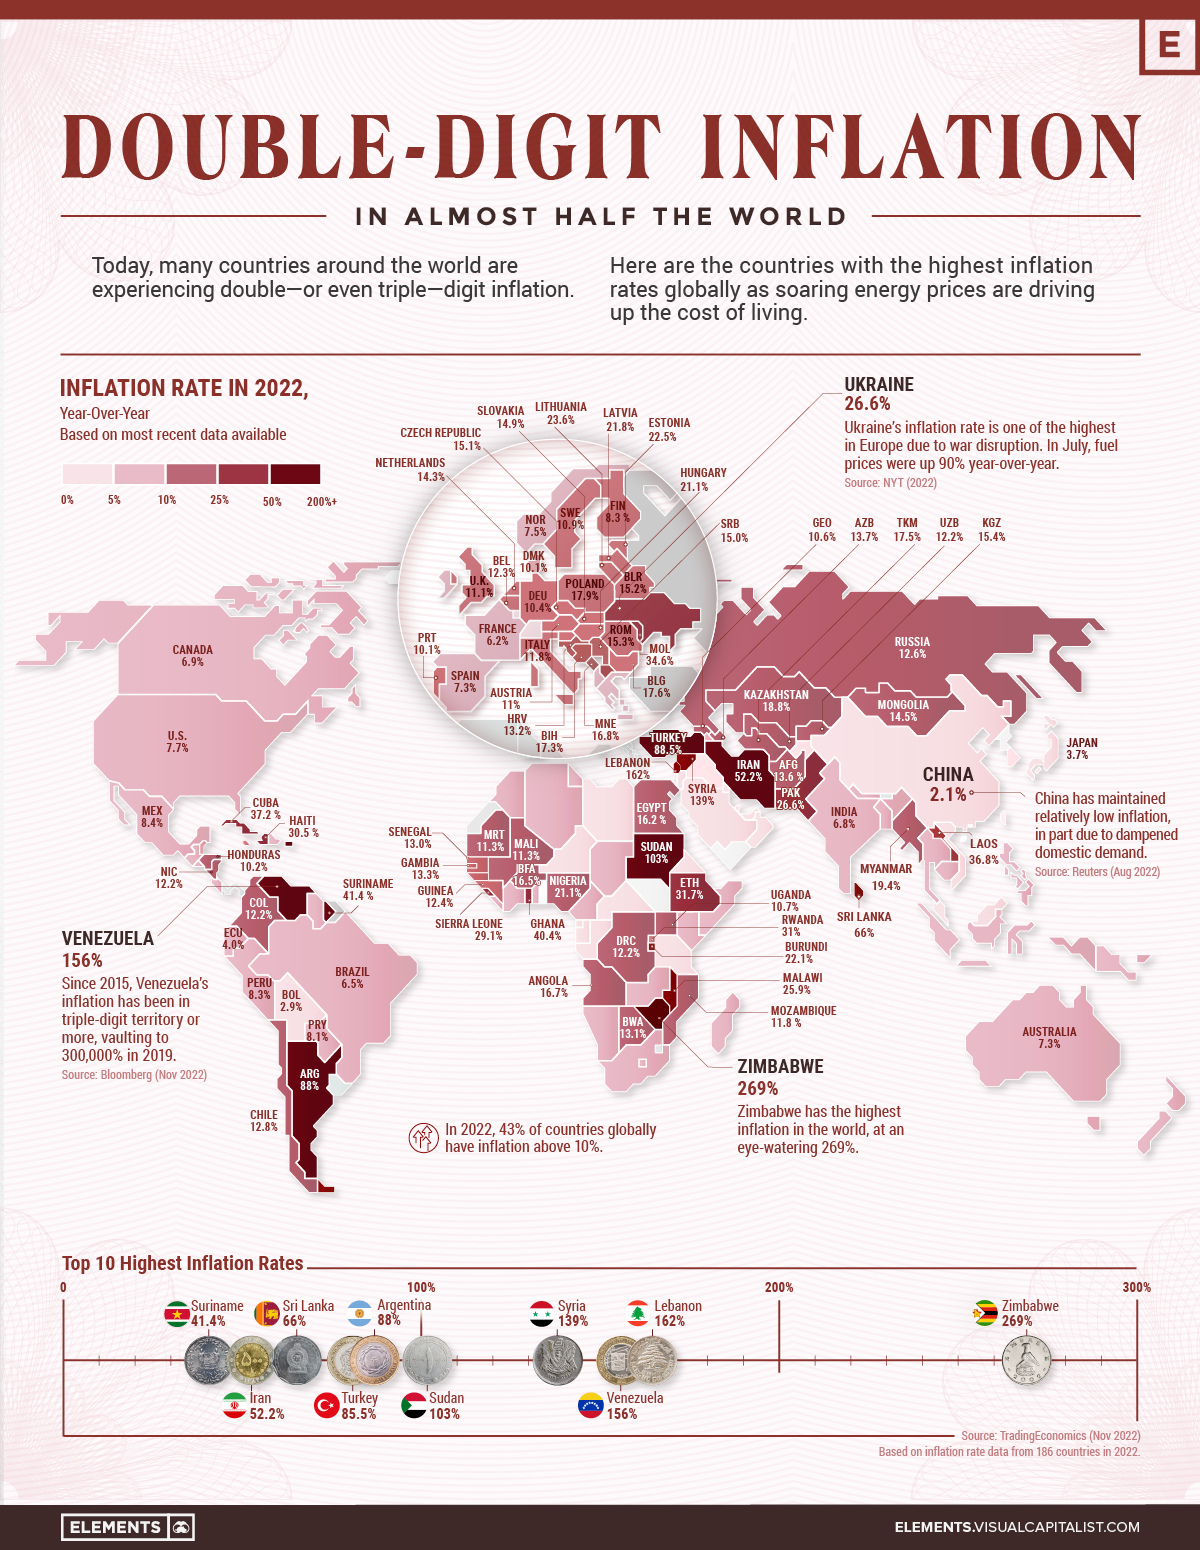
As the table below shows, countless countries are navigating record-high levels of inflation. Some are even facing triple-digit inflation rates. Globally, Zimbabwe, Lebanon, and Venezuela have the highest rates in the world.


*Inflation rates based on the latest available data.

As price pressures mount, 33 central banks tracked by the Bank of International Settlements (out of a total of 38) have raised interest rates this year. These coordinated rate hikes are the largest in two decades, representing an end to an era of rock-bottom interest rates.

Going into 2023, central banks could continue this shift towards hawkish policies as inflation remains aggressively high.

The Role of Energy Prices
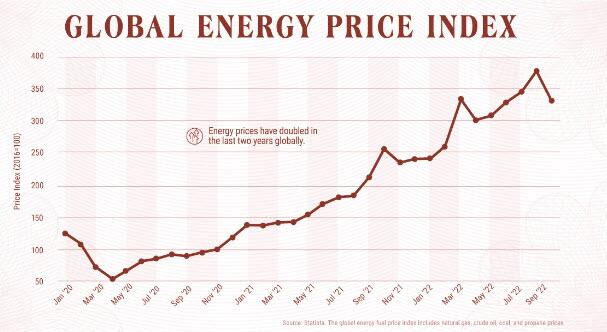
Driven by the war in Ukraine, energy inflation is pushing up the cost of living around the world.

Since October 2020, an index of global energy prices—made up of crude oil, natural gas, coal, and propane—has increased drastically.


Compared to the 2021 average, natural gas prices in Europe are up sixfold. Real European household electricity prices are up 78% and gas prices have climbed even more, at 144% compared to 20-year averages.

Amid global competition for liquefied natural gas supplies, price pressures are likely to stay high, even though they have fallen recently. Other harmful consequences of the energy shock include price volatility, economic strain, and energy shortages.

“The world is in the midst of the first truly global energy crisis, with impacts that will be felt for years to come”.
-Fatih Birol, executive director of the IEA
Double-Digit Inflation: Will it Last?
If history is an example, taming rising prices could take at least a few years yet.

Take the sky-high inflation of the 1980s. Italy, which managed to combat inflation faster than most countries, brought down inflation from 22% in 1980 to 4% in 1986.

If global inflation rates, which hover around 9.8% in 2022, were to follow this course, it would take at least until 2025 for levels to reach the 2% target.

It’s worth noting that inflation was also highly volatile over this decade. Consider how inflation fell across much of the rich world by 1981 but shot up again in 1987 amid higher energy prices. Federal Reserve chair Jerome Powell spoke to the volatility of inflation at their November meeting, indicating that high inflation has a chance of following a period of low inflation.

While the Federal Reserve projects U.S. inflation to fall closer to its 2% target by 2024, the road ahead could still get a lot bumpier between now and then.
 

Addict2sex

Well-known member
Jan 29, 2017
2,441
1,254
113
Yea, whatever, I think they just make up numbers and/or twist them to fit the government agenda...

A chart that uses official government statistics is as useless as a gun without a firing pin.
If inflation was under 7% for ten years, you can't have things that doubled in price in less than three.

Now normalize the charts for REAL inflation.
America does NOT have 7.7% inflation
And for interest rates.
Mexico and Russia have interest rates ABOVE the rate of inflation.

If russia had 12.6% inflation and ukraine(which has a dead economy) only had 26.6%, then I got a bridge to sell ya...
Now do it with Shadowstats.

Lockdown has consequences. I blame the flu virus that China and Fauci unleashed on the planet and money printing, government spending & carbon taxes!
 
Last edited:

Addict2sex

Well-known member
Jan 29, 2017
2,441
1,254
113
So inflation really had nothing to do with Biden canceling Keystone and his green initiates? I guess fox lied
The chart based on official government data that was used on the chart. We know it all lies…inflation is lot higher!! And also those carbon taxes! When did you ever know government will tell you the truth when it don’t fit their agenda. This chart i feel it is a minimum base level on inflation. I feel..it is definitely lot higher then in the graph. This don’t even include shrinkflation ,
 
Last edited:

dirtydaveiii

Well-known member
Mar 21, 2018
6,881
4,696
113
The chart based on official government data that was used on the chart. We know it all lies…inflation is lot higher!! And also those carbon taxes! When did you ever know government will tell you the truth when it don’t fit their agenda. This chart i feel it is a minimum base level on inflation. I feel..it is definitely lot higher then in the graph. This don’t even include shrinkflation ,
So you admit to intentionally spreading lies ? How MAGAGA of you
 

mandrill

Well-known member
Aug 23, 2001
74,171
79,534
113
The chart based on official government data that was used on the chart. We know it all lies…inflation is lot higher!! And also those carbon taxes! When did you ever know government will tell you the truth when it don’t fit their agenda. This chart i feel it is a minimum base level on inflation. I feel..it is definitely lot higher then in the graph. This don’t even include shrinkflation ,
Ok, go find the "REAL" inflation rates and post them for us.
 

jazzbox

Well-known member
Jan 29, 2009
1,101
521
113
The chart based on official government data that was used on the chart. We know it all lies…inflation is lot higher!! And also those carbon taxes! When did you ever know government will tell you the truth when it don’t fit their agenda. This chart i feel it is a minimum base level on inflation. I feel..it is definitely lot higher then in the graph. This don’t even include shrinkflation ,
“I feel..” that’s always a good basis to make judgements. The Bank of Canada should now base its inflation measurement on the “Addict2sex I Feel” barometer. If you would take a moment go to the Bank of Canada and look ast how they measure inflation. You may learn something and not dismiss it as all lies…

What I take from this is how low Canada’s inflation rate is in a context of widespread global inflation. Makes one wonder whether if it is not all Trudeau’s fault.
 

Addict2sex

Well-known member
Jan 29, 2017
2,441
1,254
113
“I feel..” that’s always a good basis to make judgements. The Bank of Canada should now base its inflation measurement on the “Addict2sex I Feel” barometer. If you would take a moment go to the Bank of Canada and look ast how they measure inflation. You may learn something and not dismiss it as all lies…

What I take from this is how low Canada’s inflation rate is in a context of widespread global inflation. Makes one wonder whether if it is not all Trudeau’s fault.
You realized at 7% per year if it left uncheck then 7% x 10 year = 70% inflation! Not counting compounded inflation. That how much it will cost you! That assumption earning zero rate of return in your savings. That mean every thing will be cost 70% more in 10 year.
 

Addict2sex

Well-known member
Jan 29, 2017
2,441
1,254
113
Ok, go find the "REAL" inflation rates and post them for us.
Here the real inflation rate for Canada! Calculate using 1980 based method.
You can see in blue inflation curve is above 15% which is double then the red inflation curve which is approx 7%
 
Last edited:

Frankfooter

dangling member
Apr 10, 2015
87,586
20,403
113
You realized at 7% per year if it left uncheck then 7% x 10 year = 70% inflation! Not counting compounded inflation. That how much it will cost you! That assumption earning zero rate of return in your savings. That mean every thing will be cost 70% more in 10 year.
So how does PeePee fix Canada's inflation rate?
What does a right winger do?
 
  • Like
Reactions: mandrill

mandrill

Well-known member
Aug 23, 2001
74,171
79,534
113
Here the real inflation rate for Canada! Calculate using 1980 based method.
You can see in blue inflation curve is above 15% which is double then the red inflation curve which is approx 7%
It actually appears to be only about 3% higher. And if the other countries are using the new method as well, Canada is still out-performing them.
 

mandrill

Well-known member
Aug 23, 2001
74,171
79,534
113
Get rid of Trudeau! Vote in conservative!
The usual rightie "Everything will be automatically better if you just vote for the GOP / CPC. We don't need to actually have a plan."

Yuh. Right-o!
 

Addict2sex

Well-known member
Jan 29, 2017
2,441
1,254
113
It actually appears to be only about 3% higher. And if the other countries are using the new method as well, Canada is still out-performing them.
Guess you read the a canadian inflation graph incorrectly ! If you look at the blue curve at the end point year 0ct2022 it is aprox 16% inflation then you look at the red curve at the end point of the red curve at Oct 2022 aprox 7.5 %. Then you subtract 16% -7.5%=8.5% spread.
That means it is 8.5% higher vs what you said 3% in Canada.
So It actually appears to be only about 3% higher. And if the other countries are using the new method as well, Canada is still out-performing them. So it actually to be only about 8.5 higher.And if the other countries are using the old method then Canada is in deep shit. But if the other only countries are using the new method as well, Canada is still out performing them.
 
Last edited:

Frankfooter

dangling member
Apr 10, 2015
87,586
20,403
113
Guess you read the a canadian inflation graph incorrectly ! If you look at the blue curve at the end point year 0ct2022 it is aprox 16% inflation then you look at the red curve at the end point of the red curve at Oct 2022 aprox 7.5 %. Then you subtract 16% -7.5%=8.5% spread.
That means it is 8.5% higher vs what you said 3% in Canada.
So It actually appears to be only about 3% higher. And if the other countries are using the new method as well, Canada is still out-performing them. So it actually to be only about 8.5 higher.And if the other countries are using the old method then Canada is in deep shit. But if the other only countries are using the new method as well, Canada is still out performing them.
Ah, conservative logic at work.

If the stats you post don't say what you thought, then change the terms.
But only change the terms for Canada, or else it doesn't work.
 

bver_hunter

Well-known member
Nov 5, 2005
28,168
6,171
113
Guess you read the a canadian inflation graph incorrectly ! If you look at the blue curve at the end point year 0ct2022 it is aprox 16% inflation then you look at the red curve at the end point of the red curve at Oct 2022 aprox 7.5 %. Then you subtract 16% -7.5%=8.5% spread.
That means it is 8.5% higher vs what you said 3% in Canada.
So It actually appears to be only about 3% higher. And if the other countries are using the new method as well, Canada is still out-performing them. So it actually to be only about 8.5 higher.And if the other countries are using the old method then Canada is in deep shit. But if the other only countries are using the new method as well, Canada is still out performing them.
Let us look at the true inflation comparisons with all the G7 Countries. Only Japan and France have lower inflation rates. If you take Energy and Food Inflation, Canada is the second lowest!!


Ashley Madison
Toronto Escorts