
asking the average person to give a shit about the environment is useless since many cannot manage their finances nor weight


Global Warming. Fact or grossly exaggerated??
- Thread starter AK-47
- Start date
Speaking of unbelievable, I know you can't read charts, so I'll help you out a bit.Unbelievable. We have confronted these challenges before -- either you don't know what year this is, or you don't know what a "decade" is.
Let me help you. This is 2014 (not 2001), and a decade is 10 years.
You're correct when you say the temperature has increased about 0.2 degrees Celsius from 1990 to now.
However, that only represents an average change of 0.1 degrees Celsius per decade. The IPCC predicted 0.2 degrees Celsius per decade, or 0.4 degrees over 20 years.
Scroll up to post #1325
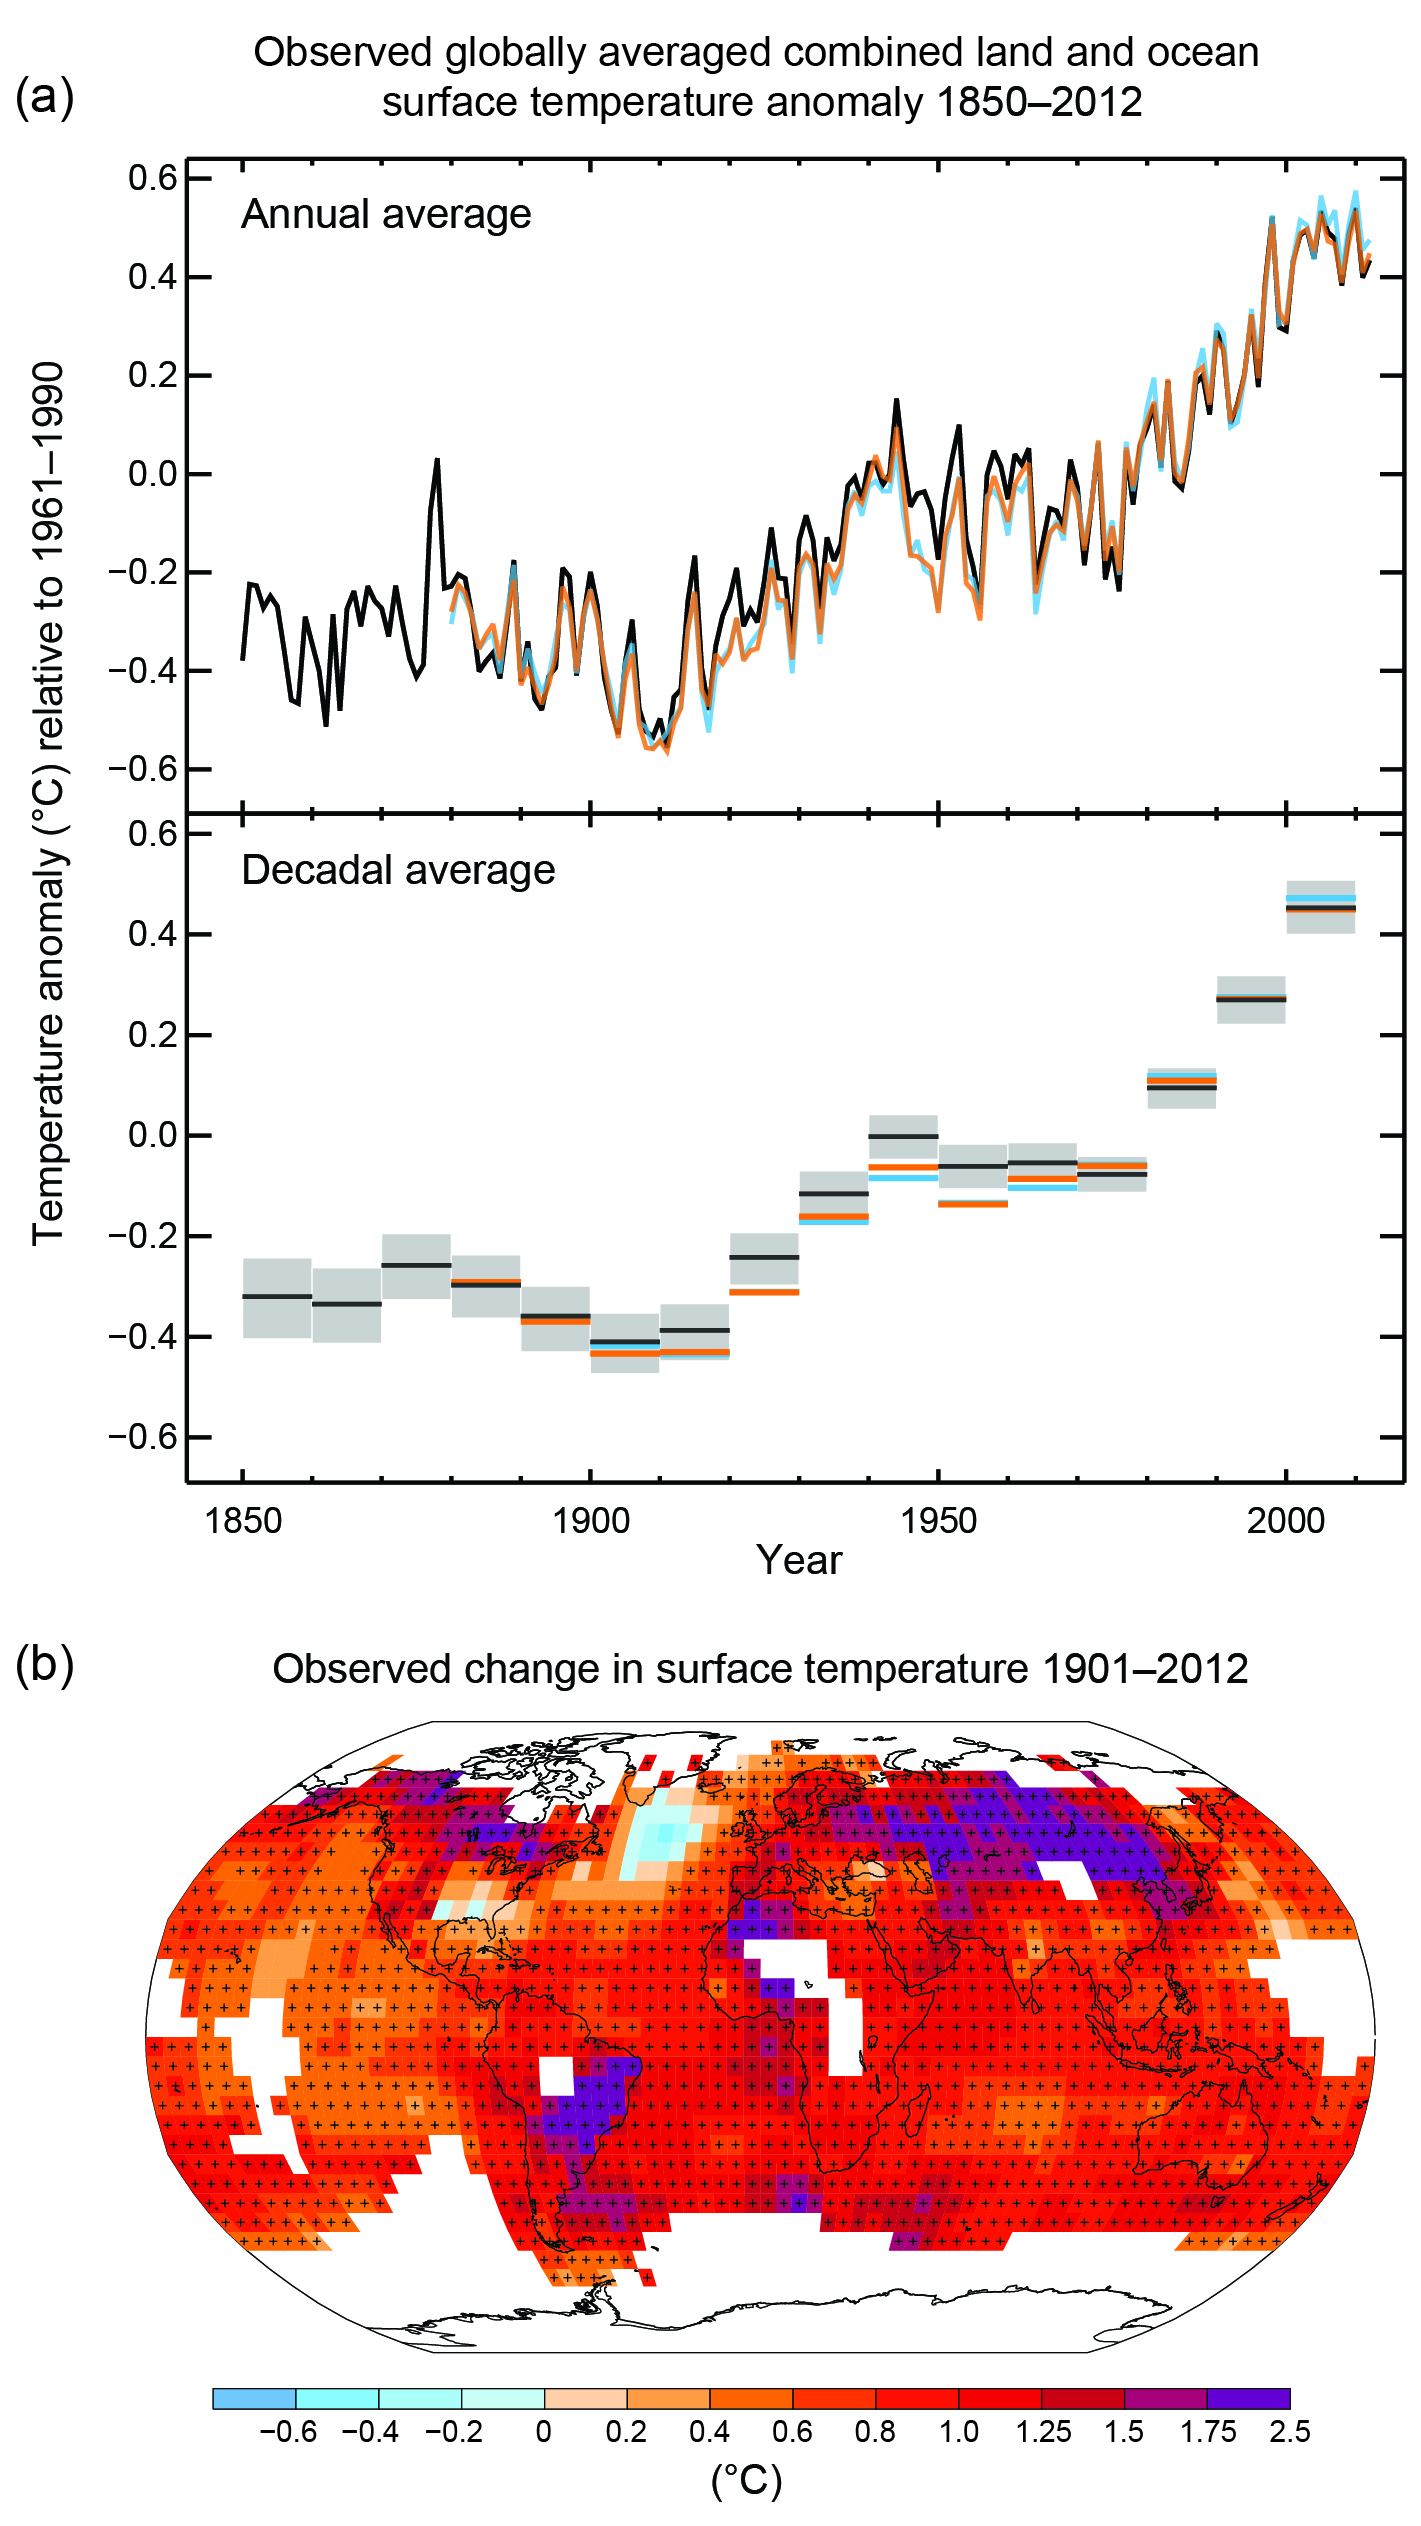
Take a look at the middle panel of the first chart on temperature anomaly.
The one that says 'decadal average' (not the global mapping of temperature anomaly in the very bottom of the graphic.
Take a look at the parts of the graph from 1980 (or 1990 if you prefer to start at the start of the IPCC predictions).
Note that each bar goes up by about 0.2ºC each decade.
Now here's the hard part, try not immediately searching your lobbyist blogger sites for a copy and paste rebuttal.
Just look at the chart and let it sink in.
Then try to answer to that in your own words.
Here, I'll even post the chart again for you.
One of the most sensitive are the krill which is basically at the bottom of the aquatic food chain, although they eat diatoms, other algae and phyto/zooplankton. They affected by temperature changes, ocean acidity, their own food source, and sea ice coverage.that might not seem like a lot but some ecosystems depend on a certain temp range and if you keep nudging up the temp it could collapse and what replaces it might not be as desirable
You're really reaching. Your "decadal" chart only shows a 1.5 degrees Celsius change from one "decadal" average to the next. It doesn't include the most recent years in the continuing pause, nor does it change the fact that the actual increase in the temperature of the planet from 1990 to now -- which is what the IPCC predicted -- is only about half of what was predicted.The one that says 'decadal average' (not the global mapping of temperature anomaly in the very bottom of the graphic.
Take a look at the parts of the graph from 1980 (or 1990 if you prefer to start at the start of the IPCC predictions).
It also doesn't account for the fact that the IPCC predicted in 1990 that the temperature increases would be 0.3 degrees Celsius per decade -- so your "decadal" average is only half of the predicted increase in actual temperatures.
The IPCC has been clear.
The IPCC reported that the change over the long term has only been 0.12 degrees Celsius per decade, and the increase in the most recently recorded 15-year period was only 0.05 degrees Celsius per decade (statistically insignificant) when the IPCC predicted it should have been 0.2 degrees Celsius per decade.
Want to see something funny?Here you go, check the difference in temperature anomaly from 1996 to 2013, its about 0.4ºC on this chart, right about where the IPCC predicted it would be.
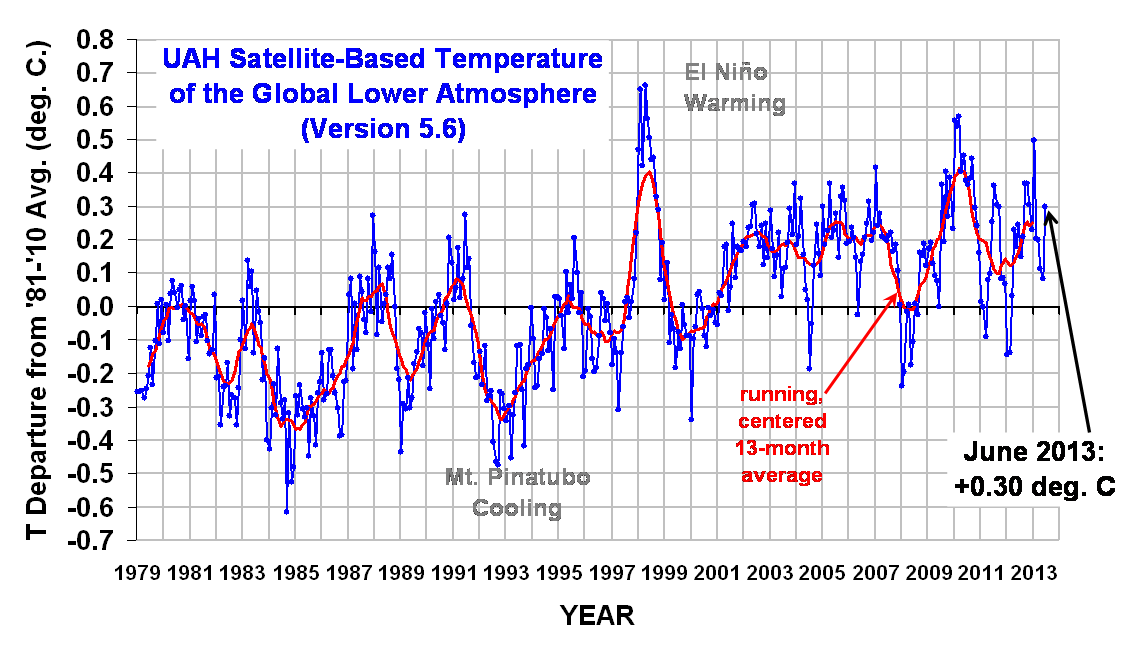
Guess where Groggy got the above chart? Believe it or not, it's a chart that was produced by climate skeptic Roy Spencer, the dreaded "Creationist":
http://www.drroyspencer.com/2013/07/uah-v5-6-global-temperature-update-for-june-2013-0-30-deg-c/
I guess Groggy will quote anyone in his desperate efforts to defend the IPCC.
Another argument bought and paid for and presented to you by Heartland (Spencer) and your friendly neighbourhood fossil fuel company (Curry)Want to see something funny?
Guess where Groggy got the above chart? Believe it or not, it's a chart that was produced by climate skeptic Roy Spencer, the dreaded "Creationist":
http://www.drroyspencer.com/2013/07/uah-v5-6-global-temperature-update-for-june-2013-0-30-deg-c/
I guess Groggy will quote anyone in his desperate efforts to defend the IPCC.
Curry's expert observations include, 'the climate always changes'. Duh.
Take it up with Groggy. Roy Spencer is his expert witness. :thumb:Another argument bought and paid for and presented to you by Heartland (Spencer)
Both groggy and dumbrock are a fucking joke!Want to see something funny?
Guess where Groggy got the above chart? Believe it or not, it's a chart that was produced by climate skeptic Roy Spencer, the dreaded "Creationist":
I guess Groggy will quote anyone in his desperate efforts to defend the IPCC
I dont even think they know what they're arguing anymore. They just wanna give themselves the illusion that they're winning the debate, even though they're both completely clueless
That link is one of a hundred or so that have used it in their discussions. The original source is NASAWant to see something funny?
Guess where Groggy got the above chart? Believe it or not, it's a chart that was produced by climate skeptic Roy Spencer, the dreaded "Creationist":
http://www.drroyspencer.com/2013/07/uah-v5-6-global-temperature-update-for-june-2013-0-30-deg-c/
I guess Groggy will quote anyone in his desperate efforts to defend the IPCC.
http://data.giss.nasa.gov/gistemp/graphs_v3/Fig.C.gif
Such a rookie mistake
The trend of the graph is still increasing. So is this one;

and this one;

and this one;

and this one;

All from the same NASA source. Note the slope (technical term) of the graphs.
Groggy's source is NASA, not Spencer. No need to take it up with Groggy.Take it up with Groggy. Roy Spencer is his expert witness. :thumb:
Get back to arguing climate and weather, more you style, around, and around, and around, like a hurricane, or is it a cyclone, or maybe a typhoon.Both groggy and dumbrock are a fucking joke!
I dont even think they know what they're arguing anymore. They just wanna give themselves the illusion that they're winning the debate, even though they're both completely clueless
Rockie, you are universally known as one of the dumbest guys on this forum. I'm not trying to be mean-spirited, thats just the truth. And the fact the global warming movement has you as its spokesman should set off warning bells to all others who still buy into the global warming scamGet back to arguing climate and weather, more you style, around, and around, and around, like a hurricane, or is it a cyclone, or maybe a typhoon
You wouldn't know the truth if it bit you on the ass. Coming from you, I'm not too worried. Still waiting for the explanation of the Xand Y axis in you useless graph earlier on. I guess you don't have the answer as usual.Rockie, you are universally known as one of the dumbest guys on this forum. I'm not trying to be mean-spirited, thats just the truth. And the fact the global warming movement has you as its spokesman should set off warning bells to all others who still buy into this global warming scam
Nice try.The original source is NASA.
NASA may be the source of the data but the chart that Groggy provided was produced by Roy Spencer, the Creationist.
Do you think rockie even knows the difference??Nice try.
NASA may be the source of the data but the chart that Groggy provided was produced by Roy Spencer, the Creationist
Dumbrock..the difference between source and author, is like the difference between climatology and meteorology....get it???? lol
Wait a second!Want to see something funny?
Guess where Groggy got the above chart? Believe it or not, it's a chart that was produced by climate skeptic Roy Spencer, the dreaded "Creationist":
http://www.drroyspencer.com/2013/07/uah-v5-6-global-temperature-update-for-june-2013-0-30-deg-c/
I guess Groggy will quote anyone in his desperate efforts to defend the IPCC.
Are you saying that Roy Spencer is not trustworthy and we should take his work as bullshit propaganda?
Ok, I accept your point.
IPCC only from now on.
That's great, first you specified info had to come from climatologists (which is great, counts out all creationists and clowns).
Now we all agree that people like Spencer aren't trustworthy.
Agreed,
(by the way, here's the link for his data: http://www.nsstc.uah.edu/data/msu/t2lt/uahncdc_lt_5.6.txt)
The noaa data is here:
http://www.ncdc.noaa.gov/cag/time-series/global/globe/land_ocean/ytd/12/1880-2013?trend=true&trend_base=10&firsttrendyear=1880&lasttrendyear=2013
I just find it amusing when even the lobbyists prove the IPCC correct.
But fine, lets stick to the real scientists, the IPCC.
And just for added bonus, here's a statement by Dr Roy.
"It is a little known fact that the extra carbon dioxide (and methane, an especially potent greenhouse gas) emitted by joggers accounts for close to 10% of the current Global Warming problem."
You certainly don't, bug.Dumbrock..the difference between source and author, is like the difference between climatology and meteorology....get it???? lol
Here you go global warming faithers, if you think a small group of insiders could never (or would never) manipulate data to serve their own financial interest, you better think again. And make sure you watch this video on how US stock market is being controlled by a small number of brokers:
http://www.cbsnews.com/news/is-the-us-stock-market-rigged/
http://www.cbsnews.com/news/is-the-us-stock-market-rigged/
You're trying to equate the wolves of Wall Street with the international research community? Then again aren't you the guy that said all research was government funded. No one has ever claimed research scientists never manipulate data, certainly no one here. Just mot the extent you want us to believe.Here you go global warming faithers, if you think a small group of insiders could never (or would never) manipulate data to serve their own financial interest, you better think again. And make sure you watch this video on how US stock market is being controlled by a small number of brokers:
http://www.cbsnews.com/news/is-the-us-stock-market-rigged/
