


Europe's hypocrisy on fossil fuels
- Thread starter oil&gas
- Start date
The oil & gas industry is accusing others of hypocrisy on fossil fuels?

What amuses me about all of this is that countries are trying to slash carbon emissions and invest in renewable and green energy....yet it cannot be done over night. And the situation in Europe became more complex due to Russia invading Ukraine. It's easy for oil and gas advocates to call out this hypocrisy while they are also actively sabotaging or delaying efforts to fix the problem. And then they continue to deny climate change. This despite the changing climate. Severe droughts in many places around the world. California is having a historic drought. Water levels on ancient rivers and lakes are dropping at an alarming rate. Record temperatures and heat waves are killing thousands. SMH
Who are the oil and gas advocates calling hypocrisy and delaying efforts you areWhat amuses me about all of this is that countries are trying to slash carbon emissions and invest in renewable and green energy....yet it cannot be done over night. And the situation in Europe became more complex due to Russia invading Ukraine. It's easy for oil and gas advocates to call out this hypocrisy while they are also actively sabotaging or delaying efforts to fix the problem. And then they continue to deny climate change. .......................
talking about?
The west told the rest of the world in COP26 (where majority of them are not known
to be climate deniers) to phase out coal. And yet they are buying coal from parts of the
world where people have to burn fossil fuel because they unlike the affluent west
could not afford nuclear power and renewable energy. If people in Indonesia and
Colombia are the climate deniers and oil and gas advocates you have in mind I can
assure you their per capita energy consumption will be way smaller than Europeans
in this winter even with all the energy content of all the coal imported from them
excluded. Apparently air-conditioning is a luxury in the developing world but
a warm and comfortable winter is absolutely essential in Europe.
it can not be done with green energy , period]What amuses me about all of this is that countries are trying to slash carbon emissions and invest in renewable and green energy....yet it cannot be done over night.
It is pretty niave to believe Putin would not take advantage of the leverage presented to him by foolish european green energy policiesAnd the situation in Europe became more complex due to Russia invading Ukraine.
It is pretty niave to believe they were immune from geopoltical conflict risk
Do not assume skepticism for AGW is driven by oil and gas interestsIt's easy for oil and gas advocates to call out this hypocrisy while they are also actively sabotaging or delaying efforts to fix the problem.
In addition, independent of one’s position on AGW
Anyone who understands the energy dependency of the basic necessities of life should be alarmed by green energy policy
&
Anyone who understands the failings/ limitations of green energy should be alarmed by green energy policy
Climate changes, it always has & is expected to continue to change going forwardAnd then they continue to deny climate change. This despite the changing climate.
The fallacy is the belief that man can control our extremely complex, nonlinear, dynamic and chaotic climate system
you are parroting propagandaSevere droughts in many places around the world. California is having a historic drought. Water levels on ancient rivers and lakes are dropping at an alarming rate. Record temperatures and heat waves are killing thousands. SMH
California has droughts because they have 60 million people & a ton of agriculture drawing from man made water system which were never intended to accommodate that capacity

Cliff Clavin is wrong again.it can not be done with green energy , period

Costa Rica Has Run on 100% Renewable Electricity for 299 Days
For 75 days straight, Costa Rica ran on 100% renewable electricity
Costa Rica

Europe

it can not be done with green energy , period
Europe
it can not be done with green energy , period
This is interesting
it looks like global warning might be urban development in disguise
the U.S. Climate Reference Network (USCRN), NOAA started it in 2005 and noted that it was aiming for “superior accuracy and continuity in places that land use will not likely impact during the next five decades”.
May 2022 is a tad cooler than the May 2005 start date
Odd how this is kept quite

U.S. Surface Climate Observing Reference Networks (noaa.gov)
it looks like global warning might be urban development in disguise
the U.S. Climate Reference Network (USCRN), NOAA started it in 2005 and noted that it was aiming for “superior accuracy and continuity in places that land use will not likely impact during the next five decades”.
May 2022 is a tad cooler than the May 2005 start date
Odd how this is kept quite
U.S. Surface Climate Observing Reference Networks (noaa.gov)
I just proved you wrong, so you moved the goalposts and said it can't be done in Europe.it can not be done with green energy , period
Total loser move.
You're still wrong, even with the goalposts over there.
The Scottish government announced its gross electricity consumption from renewable sources was 98.6% in 2020, narrowly missing its 100% target.
Its like your science claims, you come up with these weirdo theories that nobody in their right mind believes and when they get debunked you just bring out the next one.
Funny, if you actually run the plot on the USCRN website, (Thanks for the link, btw) (https://www.ncei.noaa.gov/access/monitoring/national-temperature-index/time-series/anom-tavg/1/0)This is interesting
it looks like global warning might be urban development in disguise
the U.S. Climate Reference Network (USCRN), NOAA started it in 2005 and noted that it was aiming for “superior accuracy and continuity in places that land use will not likely impact during the next five decades”.
May 2022 is a tad cooler than the May 2005 start date
Odd how this is kept quite
View attachment 168110
U.S. Surface Climate Observing Reference Networks (noaa.gov)
you find that May 2005 had an Average Temperature Anomaly of -1.55F and May 2022 had one of +1.08F.
So according to this data set, May 2022 was 2.63F (~1.46K) degrees hotter.
Why you would want to do a spot comparison like that and not a trend given how noisy the data is escapes me, though.
Its a typical oil lobbyist, 'researcher' tactic used to keep climate change deniers happy by fuelling their confirmation bias.Funny, if you actually run the plot on the USCRN website, (Thanks for the link, btw) (https://www.ncei.noaa.gov/access/monitoring/national-temperature-index/time-series/anom-tavg/1/0)
you find that May 2005 had an Average Temperature Anomaly of -1.55F and May 2022 had one of +1.08F.
So according to this data set, May 2022 was 2.63F (~1.46K) degrees hotter.
Why you would want to do a spot comparison like that and not a trend given how noisy the data is escapes me, though.
If you looked at mr science's chart on hurricane activity he posts, its a great example.
You take a data set with small numbers, 0-25 hurricanes a year or whatever the real number is, and then pick a high date at the start and a low number at the end.
Then you draw a line from the high number to the low number and claim that hurricanes are declining.
Its a combination of cherry picking your data points combined with claims of reliability with too small a sample set.
But people like larue buy and you can't argue otherwise with him.
good one, numbers do not lieFunny, if you actually run the plot on the USCRN website, (Thanks for the link, btw) (https://www.ncei.noaa.gov/access/monitoring/national-temperature-index/time-series/anom-tavg/1/0)
you find that May 2005 had an Average Temperature Anomaly of -1.55F and May 2022 had one of +1.08F.
So according to this data set, May 2022 was 2.63F (~1.46K) degrees hotter.
I can not account for Chris Morrison's representation of May 2022 vs May 2005
Hopefully it was an honest mistake , perhaps a carry over from April 2022 (-1.01 F) vs April 2005 (+0.23 F)
Was it intentional deceit?
That would be disapointing as there is more than enough deceit from alarmists
Perhaps to show April 2022 was marginal cooler than 17 years earlier , despite continued increases in ppm of CO2Why you would want to do a spot comparison like that and not a trend given how noisy the data is escapes me, though.
17 years quite a long time for the evil CO2 molecule to take a rest from its quest to char broil the planet,
odd how you avoid the bigger question
Why is this purpously being keep quite ?
We get bombarded with alarmist Climate Change media including its impact on earthworms and the reproductive habits of the three toed sloth,
but an abscence of warming for 17 years...... nada
all time series anomaly temp datasets will have noise
so many factors can affect a tempature reading & the very nature of calulating a monthly average across stations dispered across the USA, will generate noise
The important thing to understand is this data set was designed to eliminate/ minimize the noise caused by the urban island heat effect
17 years without warming, not consistant with AGW
this clearly shows there is no definative trend
And no definative trend in the plot from your link for all months

Yes, that was an attempt at deceipt.good one, numbers do not lie
I can not account for Chris Morrison's representation of May 2022 vs May 2005
Hopefully it was an honest mistake , perhaps a carry over from April 2022 (-1.01 F) vs April 2005 (+0.23 F)
Was it intentional deceit?
That would be disapointing as there is more than enough deceit from alarmists
This is cherry picking data.
The questions that need asking are:
1) Why pick a 17 year time frame?
2) Why this 17 year time frame?
3) Why pick a subset of national charts in a debate about global climate?
Its as deceitful as the first example.
Quite short actually, as you should know since you study the field so much.Perhaps to show April 2022 was marginal cooler than 17 years earlier , despite continued increases in ppm of CO2
17 years quite a long time for the evil CO2 molecule to take a rest from its quest to char broil the planet,
What is being kept quiet?odd how you avoid the bigger question
Why is this purpously being keep quite ?
We get bombarded with alarmist Climate Change media including its impact on earthworms and the reproductive habits of the three toed sloth,
but an abscence of warming for 17 years...... nada
Other than this one clip you've used here, do we know that this data isn't being used?
You reproduced the chart yourself in your post and show that the USCRN and the ClimDiv data (which is the one usually cited) agree almost exactly.
So it doesn't look like anyone is hiding anything, they are just reporting one set since the two sets agree.
Yes, which is why it would be ridiculous to point to one month and then another month and say "See? It cooled, not warmed!" and yet that is basically what this guy did.all time series anomaly temp datasets will have noise
so many factors can affect a tempature reading & the very nature of calulating a monthly average across stations dispered across the USA, will generate noise
(And then fucked it up by picking two points where it warmed instead.)
The important thing to understand is this data set was designed to eliminate/ minimize the noise caused by the urban island heat effect
17 years without warming, not consistant with AGW
this clearly shows there is no definative trend

And no definative trend in the plot from your link for all months
View attachment 168252
Actually, if you draw a trend line through the monthly data from the site, you get a warming trend.

You can do it yourself if you like, the data is free on the link.
I don't know why this Chris Morrison guy says there is no trend in data that's freely available to check, but whatever.
if 150 years is enough for the alarmists to declare the science settled , then 17 years is significantQuite short actually, as you should know since you study the field so much.
Apprently significant enough to be avoided by alarmists
it is also the entire hisory of this data set, which raises the question how much of the surface data prior to 2005 is contaminated by the urban island heat effect
Not so sure ClimDiv data is what alarmists or frankfooter have used as 'chart evidence for AGW , frankies graphs alawys have huge slopeWhat is being kept quiet?
Other than this one clip you've used here, do we know that this data isn't being used?
You reproduced the chart yourself in your post and show that the USCRN and the ClimDiv data (which is the one usually cited) agree almost exactly.
So it doesn't look like anyone is hiding anything, they are just reporting one set since the two sets agree.
either way there is a 17 year period of no warming left unexplained
And that just should not have hapnened, according to AGW theroy and the propaganda effort
Thats more than the life span of alarmists favourite target audience - children
Hi little Jimmy, the planet is heating up because of your daddy's SUV & your Moms air flights and its their fault your going to be char broiled
Oh, yeah, the USA has not warmed since 5 years before you were born..... but believe me, your screwed anyways
your point on Chris Morrison's representation of May 2022 vs May 2005 was made and acknowledgedYes, which is why it would be ridiculous to point to one month and then another month and say "See? It cooled, not warmed!" and yet that is basically what this guy did.
(And then fucked it up by picking two points where it warmed instead.)
However based on all the hype and propaganda, the average person would assume there is no way in the world April 2005 USA was marginaly warmer than April 2022 USA
They would likly be quite surprized that it was
Actually, if you draw a trend line through the monthly data from the site, you get a warming trend.
You can do it yourself if you like, the data is free on the link.
I don't know why this Chris Morrison guy says there is no trend in data that's freely available to check, but whatever.
There is no trend line tool on the page i used
The only trend here is the zero axis
The scales and labels on your chart ( only left hand scale, , no ClimDiv data) are differeent from the one shown below & from the one Chris Morrison used.
your trendlines stat is preety small & faint but the R squared value is 0.026 >>> next to none of the variance from an expected value is explained by the tendline modeled slope.
your x-axis is also just a series of sequental numbers, vs years displayed for Chris Morrison.
Do we just assume you are working with the same time frequency and time period?
the peaks & valley structures appear similar., but yours is a different chart
I don't know why you would use a different chart to try and cancel this Chris Morrison guy , but whatever.
no preeptiable slope here
17 years of no warming should be good news , apprently not for alarmists

Last edited:
17 is considered minimal for a climate trend, if I recall. (I'd have to go digging in the literature to see).if 150 years is enough for the alarmists to declare the science settled , then 17 years is significant
Apprently significant enough to be avoided by alarmists
You should know this, since you follow the science.
A very good question, which is why temperatures are studied in so many ways and cross referenced with each other and other indicators constantly.it is also the entire hisory of this data set, which raises the question how much of the surface data prior to 2005 is contaminated by the urban island heat effect
You should know this, since you follow the science.
First - You are the one who left the climDiv data on your chart. If you don't believe it is real data from the same place you are getting the data you want to believe in, then that's on you.Not so sure ClimDiv data is what alarmists or frankfooter have used as 'chart evidence for AGW , frankies graphs alawys have huge slope
either way there is a 17 year period of no warming left unexplained
And that just should not have hapnened, according to AGW theroy and the propaganda effort
Second - There was warming over that 17 years according to the data your posted.
Third - There is nothing in AGW that says you can't have a spell of time with minimal or no warming, especially a relatively short one.
And then someone would point out to them that there is a lot of noise so they shouldn't be surprised.your point on Chris Morrison's representation of May 2022 vs May 2005 was made and acknowledged
However based on all the hype and propaganda, the average person would assume there is no way in the world April 2005 USA was marginaly warmer than April 2022 USA
They would likly be quite surprized that it was
It is like when people point to snow in winter and say "Global warming is fake!".
Some people will never figure that out, but most intelligent people can understand the difference between trend and noise.
As I said, the data is freely available.There is no trend line tool on the page i used
The only trend here is the zero axis
The scales and labels on your chart ( only left hand scale, , no ClimDiv data) are differeent from the one shown below & from the one Chris Morrison used.
your trendlines stat is preety small & faint but the R squared value is 0.026 >>> next to none of the variance from an expected value is explained by the tendline modeled slope.
your x-axis is also just a series of sequental numbers, vs years displayed for Chris Morrison.
Do we just assume you are working with the same time frequency and time period?
the peaks & valley structures appear similar., but yours is a different chart
It is right there on the link.
Download it, put it in excel or whatever you want to use for a stats program, and calculate a trend line.
Do it yourself.
Stop relying on other people to tell you what to think and actually look at the data and the facts.
Does "cancel" mean "disagree with" in your world?I don't know why you would use a different chart to try and cancel this Chris Morrison guy , but whatever.
Take the data and run it yourself.
It isn't hard.
I love that you just reposted the data that shows warming.
do not tell me what I should know17 is considered minimal for a climate trend, if I recall. (I'd have to go digging in the literature to see).
You should know this, since you follow the science.
focus on what you do or do not know
"considiered" , so a subjective value in a branch of science with roughly double that age?
its more than 10% of time frame the alarmist claim is sufficient to call the science settled , so 17 years is enough to circle and say 'hypothesis failed' , please explain
The alarmists picked the time frame for their hypothisis.
do not tell me what I should knowA very good question, which is why temperatures are studied in so many ways and cross referenced with each other and other indicators constantly.
You should know this, since you follow the science.
focus on what you do or do not know
cross referencing tempature data sets ?
How does one cross refence data orginating from a city airport which has been moved three times due to expansion with data from the mountains of Idahoe
Left it on the chart? WTF ?? The only other option would be to hide it. I am not in the business of deceitFirst - You are the one who left the climDiv data on your chart. If you don't believe it is real data from the same place you are getting the data you want to believe in, then that's on you.
Nope that is flat, hold a flat edge across your screen, it slices it right in the middle, no angleSecond - There was warming over that 17 years according to the data your posted.
Thats flat

actually no , photons travel at the speed of light and GHG molecules are incapable of storing IR energyThird - There is nothing in AGW that says you can't have a spell of time with minimal or no warming, especially a relatively short one.
They absorb energy and re-emit energy or transfer the energy immediately
You have noticed it geeting cooler when the sun goes down right?
You should know this, since you go outside, dont you?
GHG do not take extended 17 year vacations
In addition CO2 hss been increasing roughly 2 ppm per year so roughly 35 to 40 ppm over those 17 years (woe, a 10% increase)
AGW dictates that increase MUST cause more warming
AGW ignores the possibility of "Saturation" & temporary staturation for 17 years of increasing concentation is not phsically possible
One would think so, however, that would imply all propaganda efforts should fail and we know that is not the caseAnd then someone would point out to them that there is a lot of noise so they shouldn't be surprised.
It is like when people point to snow in winter and say "Global warming is fake!".
Some people will never figure that out, but most intelligent people can understand the difference between trend and noise.
Dr. Gobbles sadly proved that and he did have the internet to work with
the propaganda has embeeded such persistant image of AGW with a huge upward bias trend , that there should be no way April 2005 was warmer than April 2022.
That will be just about everyones intial thought
Now exclude the AGW propganda campaign
You call it noise, and I call any precieved change in the last 150 years noise
besides the tend here is clearly flat

I do not need to , the trend is flat and you already showed a miniscule R squared - your independant variable (time) explains very little of your dependant variable (temp)As I said, the data is freely available.
It is right there on the link.
Download it, put it in excel or whatever you want to use for a stats program, and calculate a trend line.
That is no trend for a time series plot
it is number noodling in excel
You can calculate the sin of the angle of that line to the axis in excel as well, that does not mean the resulting figure has descriptive value
#1. Do not tell me what to doDo it yourself.
Stop relying on other people to tell you what to think and actually look at the data and the facts.
why would I take orders from someone i have zero respect for ?
#2. I already generated the graph , what you think you have been looking at?
No, however you have provided others with instructions to cancel meDoes "cancel" mean "disagree with" in your world?
"Mention Adebatic and see if he goes away"
And you dart in and out of threads with half explained insults, so cancelling is your thing
Sad and dispicable behaviour
You might reconsider that approach
why would I take orders from someone i have zero respect for ?Take the data and run it yourself.
It isn't hard.
It has been run for 17 years & no warming
the trend is flat and you already showed a miniscule R squared - your independant variable (time) explains very little of your dependant variable (temp)I love that you just reposted the data that shows warming.
Last edited:
You don't know the science or the correct numbers.do not tell me what I should know
In addition CO2 increases roughly 2 ppm per year so roughly 35 to 40 ppm over those 17 years (woe, a 10% increase)
AGW dictates that MUST cause more warming
AGW ignores the possibility of "Saturation"
NASA has found that increases to the greenhouse effect have increased the amount of energy reaching the surface of the planet by 0.5 Watts per square metre between 2003-2018.
Abstract
Changes in atmospheric composition, such as increasing greenhouse gases, cause an initial radiative imbalance to the climate system, quantified as the instantaneous radiative forcing. This fundamental metric has not been directly observed globally and previous estimates have come from models. In part, this is because current space-based instruments cannot distinguish the instantaneous radiative forcing from the climate’s radiative response. We apply radiative kernels to satellite observations to disentangle these components and find all-sky instantaneous radiative forcing has increased 0.53 ± 0.11 W/m2 from 2003 to 2018, accounting for positive trends in the total planetary radiative imbalance. This increase has been due to a combination of rising concentrations of well-mixed greenhouse gases and recent reductions in aerosol emissions. These results highlight distinct fingerprints of anthropogenic activity in Earth’s changing energy budget, which we find observations can detect within 4 years.
If you take a vegetarian and lock that person in a room for three days without food and suddenly toss a steak in there, the person will eat it because there is nothing else. That is not hypocrisy. That is survival.....
Climate Change: Global Temperature
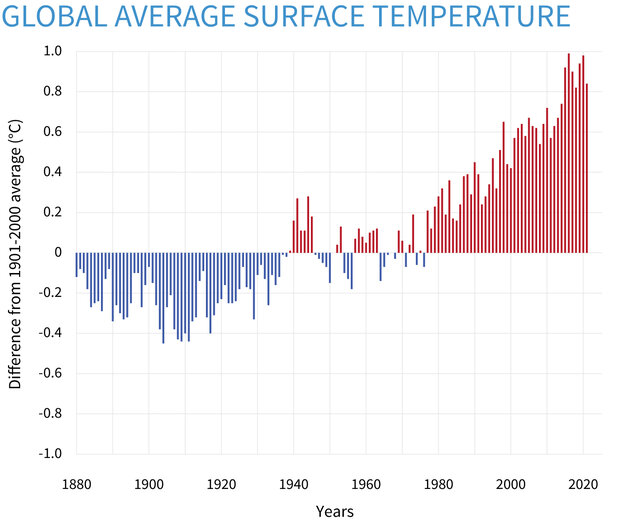
Given the tremendous size and heat capacity of the global oceans, it takes a massive amount of heat energy to raise Earth’s average yearly surface temperature even a small amount. The roughly 2-degree Fahrenheit (1 degrees Celsius) increase in global average surface temperature that has occurred since the pre-industrial era (1880-1900) might seem small, but it means a significant increase in accumulated heat.
That extra heat is driving regional and seasonal temperature extremes, reducing snow cover and sea ice, intensifying heavy rainfall, and changing habitat ranges for plants and animals—expanding some and shrinking others. As the map below shows, most land areas have warmed faster than most ocean areas, and the Arctic is warming faster than most other regions.
More Real Data:

 www.climate.gov
- Earth’s temperature has risen by 0.14° Fahrenheit (0.08° Celsius) per decade since 1880, but the rate of warming since 1981 is more than twice that: 0.32° F (0.18° C) per decade.
- 2021 was the sixth-warmest year on record based on NOAA’s temperature data.
- Averaged across land and ocean, the 2021 surface temperature was 1.51 °F (0.84 °Celsius) warmer than the twentieth-century average of 57.0 °F (13.9 °C) and 1.87 ˚F (1.04 ˚C) warmer than the pre-industrial period (1880-1900).
- The nine years from 2013 through 2021 rank among the 10 warmest years on record.
Given the tremendous size and heat capacity of the global oceans, it takes a massive amount of heat energy to raise Earth’s average yearly surface temperature even a small amount. The roughly 2-degree Fahrenheit (1 degrees Celsius) increase in global average surface temperature that has occurred since the pre-industrial era (1880-1900) might seem small, but it means a significant increase in accumulated heat.
That extra heat is driving regional and seasonal temperature extremes, reducing snow cover and sea ice, intensifying heavy rainfall, and changing habitat ranges for plants and animals—expanding some and shrinking others. As the map below shows, most land areas have warmed faster than most ocean areas, and the Arctic is warming faster than most other regions.
More Real Data:
Climate Change: Global Temperature
Earth's surface temperature has risen about 2 degrees Fahrenheit since the start of the NOAA record in 1850. It may seem like a small change, but it's a tremendous increase in stored heat.
