


Climate Alarmists Foiled: No US Warming Since 2005
- Thread starter onthebottom
- Start date


Here's the proof you are the bullshitter and I'm not lying.That is a bold face lie and you know it
Why do you intentionally try to mislead others ?
That's from the link you posted.National USHCN monthly temperature updates have been discontinued.
Poor lying larue.
Not much science in that post, larue.Too funny
There is a whole lot more of a difference between you & I. I have integrity & I understand the science
Gretta probably has a better handle on the science than you do
Your only contribution here is to spew misinformation and make really poor & comical attempts to mislead others
You do yourself & your so-called cause a great dis-service
Nobody trusts a pathological lair
Lets see, so far you have tried to bait and switch surface temperature charts with atmospheric charts, failed to understand the difference between a feedback effect and a forcing on the climate, cherry picked one discontinued chart from one country and tried to use it in a debate about global temperatures and here you are accusing me of lying.
I've nailed you on four of four claims here.
Looks like you're losing badly.
Whoops, real world data calls your article bullshit.The great failure of the climate models
....
Yet, the real-world data aren’t cooperating. They show only slight warming, mostly at night and in winter.

And finally, in what should be a final post on this thread a better look at the cherry picked chart and its source.
First off, the chart comes from the Heartland Institute, one of the largest fossil fuel disinformation organizations left running.
Here's their original chart:
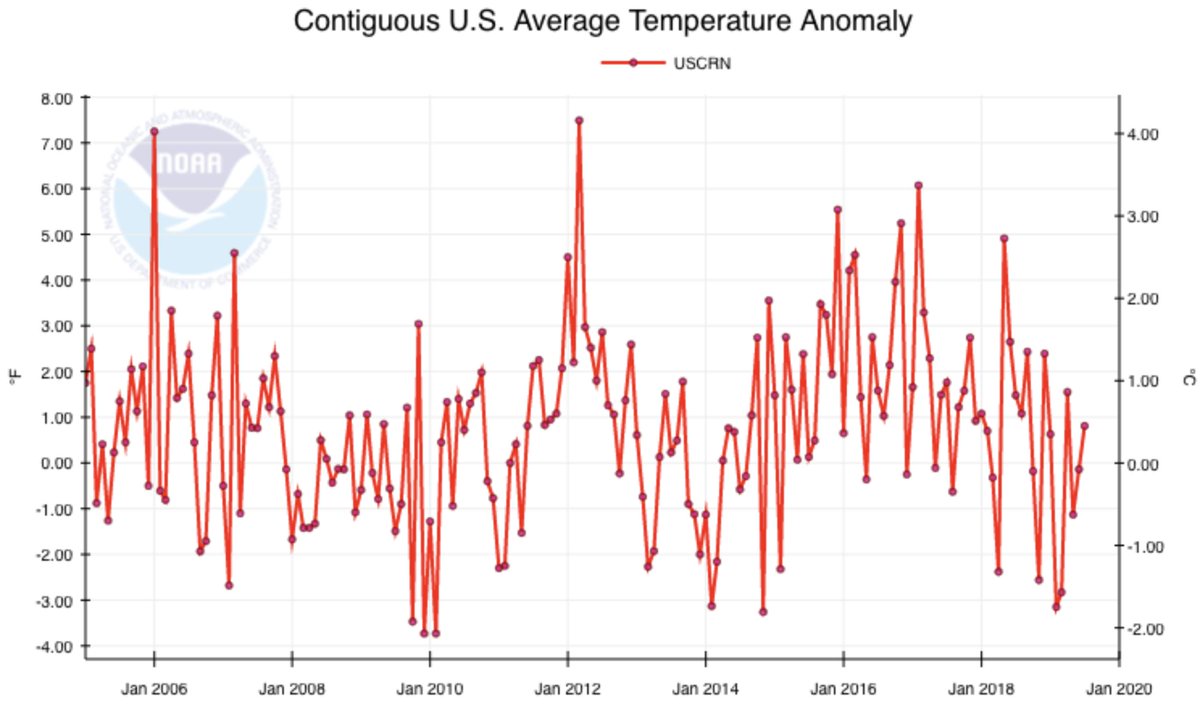
Its quite 'noisy' as it charts monthly data, which makes annual changes harder to see. Here's a version of the same data charting only annual changes:

And finally, here's that same CRN data overlaid on top of the NOAA's weather station data. Note that the discontinued CRN data matches quite well with the data that larue calls 'tainted'.

And if you calculate the trends based on that data, the CRN chart of US temp actually shows more warming than global changes and more changes than the 'tainted' data larue is trying ignore. Which pretty much kills that 'there is no warming' argument dead.
Trends (C per decade)
Global - 0.26
ClimDiv (US weather stations) - 0.19
US CRN - 0.31
This post comes from climatologist Zeke Hausfather, who took the time to rebut this stupid Heartland claim.
The full twitter thread is here.
https://twitter.com/hausfath/status/1169805837704937472
First off, the chart comes from the Heartland Institute, one of the largest fossil fuel disinformation organizations left running.
Here's their original chart:
Its quite 'noisy' as it charts monthly data, which makes annual changes harder to see. Here's a version of the same data charting only annual changes:
And finally, here's that same CRN data overlaid on top of the NOAA's weather station data. Note that the discontinued CRN data matches quite well with the data that larue calls 'tainted'.
And if you calculate the trends based on that data, the CRN chart of US temp actually shows more warming than global changes and more changes than the 'tainted' data larue is trying ignore. Which pretty much kills that 'there is no warming' argument dead.
Trends (C per decade)
Global - 0.26
ClimDiv (US weather stations) - 0.19
US CRN - 0.31
This post comes from climatologist Zeke Hausfather, who took the time to rebut this stupid Heartland claim.
The full twitter thread is here.
https://twitter.com/hausfath/status/1169805837704937472
O
OnTheWayOut
Talk about Cherry picking!!!And finally, in what should be a final post on this thread a better look at the cherry picked chart and its source.
First off, the chart comes from the Heartland Institute, one of the largest fossil fuel disinformation organizations left running.
Your guy Cherry picked the data to get rid of the evidence (noise) & then added in the tainted data from 1900
The whole basis for the USCRN data set is to ensure it remains unaffected by the urban heat Island effect
All he did was re-introduce this effect
The USCRN data set is from NOAA. An organization you have previously held up as beyond reproach
You must be so disappointed in them for acing in a responsible manner and isolating the urban heat Island effect
And then for good measure you layered on a smattering of Character Assassination
What is wrong with you?
Why are you such a DENIER of the truth?
The data clearly shows no warming for 15 years in the USA
What are going to do when 15 year turns into 16 years, 20 years, 25 years........
You can not maintain this lie forever Frankfooter
You would not know real science if it whacked you up-side of your headNot much science in that post, larue.
Lets see, so far you have tried to bait and switch surface temperature charts with atmospheric charts, failed to understand the difference between a feedback effect and a forcing on the climate, cherry picked one discontinued chart from one country and tried to use it in a debate about global temperatures and here you are accusing me of lying.
I've nailed you on four of four claims here.
Looks like you're losing badly.
It is very disturbing to watch the lengths you will go o in order to deceive others
You need professional help
Call your bullshit !Whoops, real world data calls your article bullshit.
The coming cooling: Usefully accurate climate forecasting for policy makers
Norman J Page First Published February 10, 2017 Research Article
https://doi.org/10.1177/0958305X16686488
Article information
Article has an altmetric score of 19 No Access
Abstract
This paper argues that the methods used by the establishment climate science community are not fit for purpose and that a new forecasting paradigm should be adopted. Earth’s climate is the result of resonances and beats between various quasi-cyclic processes of varying wavelengths. It is not possible to forecast the future, unless we have a good understanding of where the earth is in time in relation to the current phases of those different interacting natural quasi periodicities. Evidence is presented specifying the timing and amplitude of the natural 60 ± year and, more importantly, 1000 year periodicities (observed emergent behaviors) that are so obvious in the temperature record. Data related to the solar climate driver are discussed and the solar cycle 22 low in the neutron count (high solar activity) in 1991 is identified as a solar activity millennial peak and correlated with the millennial peak – inversion point – in the RSS temperature trend in about 2004. The cyclic trends are projected forward and predict a probable general temperature decline in the coming decades and centuries. Estimates of the timing and amplitude of the coming cooling are made. If the real climate outcomes follow a trend which approaches the near term forecasts of this working hypothesis, the divergence between the IPCC forecasts and those projected by this paper will be so large by 2021 as to make the current, supposedly actionable, level of confidence in the IPCC forecasts untenable.
https://journals.sagepub.com/doi/abs/10.1177/0958305X16686488?journalCode=eaea&
Plus,
" You are A manuipulated piece of work!

According to the NOAA your thread title is correctThe data clearly shows no warming for 15 years in the USA
Lets look at Frankfooters posts here
1
2
3.
4.
Once this was pointed out he stayed away from this argument
5.
6
7.
8.
One can not be cherry picking if one uses the entire data set
He repeats this Cheery picking argument many times desite having been shown this is not the case
9.
Calls me stupid & adds in an implied oil industry connection for good measure
10.
11
12
he re-introduces the errors the USCRN was designed to omit
13
14.
15.
16
Anyone notice a pathological pattern of disorganized, desperate and plain illogical attempts to mislead others ?
Anyone recognize someone who is is in full blown panic mode?
The Greta thread has the same pattern, only he gets really aggressive about refuting the importance of atmospheric temperatures on the Greenhouse effect
His lack of scientific understanding is on full display
He also gets far more aggressive with the character assassinations in that thread
Trust is a very difficult thing to maintain if your objective is to mislead others
1
Link providedLooks like bullshit to me.
Easy way to prove it.
Post a link to the chart from the article that's posted directly on the NOAA site.
2
The error in his logic was pointed outYes, you guys should apologize for trying to bait and switch by posting old charts that are discontinued as if they were the recent ones.
From the link:
National USHCN monthly temperature updates have been discontinued.
3.
The error in his understanding was pointed outWater vapour = feedback
CO2 = forcing
That's a stupid, high school level mistake.
4.
He tried to show the climate is driven by the oceans, without realizing this absolves CO2 as the culpritLarue, google AMOC slowdown, read a few articles and see if you can follow the debate.
Once this was pointed out he stayed away from this argument
5.
He added back the historical tainted dataWhen you don't cherry pick the dates, it shows the same warming as elsewhere on the planet.
https://www.ncdc.noaa.gov/temp-and-p...r=2019&month=8
6
Overlaid CO2 with some temp data & implied I was stupidWhen you compare global CO2 levels with global temperature you can clearly see that your claims are incredibly fucking stupid.
7.
Tried use summer Greenland melt as the evidence , while omitting the equivalent winter accumulationHoly shit, you really can't understand this, can you larue?
Greenland ice melts totalled 440 billion tonnes of ice this summer.
https://time.com/5656688/greenland-heat-climate-change/
You put that fresh water into the North Atlantic and it has an effect on the AMOC, which is slower than it has been in over 1000 years. That current is what keeps the east coast of NA and the west coast of Europe warmer than it otherwise would be. Read about what is happening for once.
https://www.scientificamerican.com/a...n-1-600-years/
https://www.earth.com/news/slowdown-...lation-system/
8.
The dataset is 15 years old & is unque to the USAYou are cherry picking one country and one time period.
One can not be cherry picking if one uses the entire data set
He repeats this Cheery picking argument many times desite having been shown this is not the case
9.
The cherry picking accusation combined with the implication atmospheric temperatures are uselessCherry picking dates and location is as dishonest as bait and switch surface and atmospheric temperatures, larue.
The question still remains whether you are so stupid as to believe the oil industry disinformation you post here or whether you know what you're doing.
Calls me stupid & adds in an implied oil industry connection for good measure
10.
again with the cherry picking accusation, only he ties to back this up by cherry picking the arctic temp recordYou still don't understand why your claim is cherrypicking, do you?
Let me show you:
Using your claim that there is no change in US temps, how do you explain the massive 3.5% change in temp in the arctic between 1999 and 2016?
11
More cherry picking accusations, Ignores the significance & uniqueness of the USCRN data setPicking discontinued data sets and then calling them 'the only untainted' is really pretty fricking sad, larue.
Totally dishonest.
12
Ignores the significance & uniqueness of the USCRN data setAlready discussed.
Larue picked a discontinued data set because when you look at the current data set, which goes further than his cherry picked 15 years, it shows warming like the rest of the planet.
https://www.ncdc.noaa.gov/temp-and-precip/us-trends/
he re-introduces the errors the USCRN was designed to omit
13
Repeats a ridiculous attempt to dismiss the USCRN data set as non-existent despite this issue having been explainedHere's the proof you are the bullshitter and I'm not lying.
National USHCN monthly temperature updates have been discontinued.
That's from the link you posted.
Poor lying larue.
14.
Pretty much summarises a series of absurd arguments which were addressed & claims victoryNot much science in that post, larue.
Lets see, so far you have tried to bait and switch surface temperature charts with atmospheric charts, failed to understand the difference between a feedback effect and a forcing on the climate, cherry picked one discontinued chart from one country and tried to use it in a debate about global temperatures and here you are accusing me of lying.
I've nailed you on four of four claims here.
Looks like you're losing badly.
15.
Introduces a chart from the 1800s , despite the real issue here is the past 15 yearsWhoops, real world data calls your article bullshit.
16
Quotes some blogger who cherry picked the USCRN data set and added back the tainted historyAnd finally, in what should be a final post on this thread a better look at the cherry picked chart and its source.
First off, the chart comes from the Heartland Institute, one of the largest fossil fuel disinformation organizations left running.
Here's their original chart:
Anyone notice a pathological pattern of disorganized, desperate and plain illogical attempts to mislead others ?
Anyone recognize someone who is is in full blown panic mode?
The Greta thread has the same pattern, only he gets really aggressive about refuting the importance of atmospheric temperatures on the Greenhouse effect
His lack of scientific understanding is on full display
He also gets far more aggressive with the character assassinations in that thread
Trust is a very difficult thing to maintain if your objective is to mislead others
Hey, larue.Talk about Cherry picking!!!
Your guy Cherry picked the data to get rid of the evidence (noise) & then added in the tainted data from 1900
The whole basis for the USCRN data set is to ensure it remains unaffected by the urban heat Island effect
All he did was re-introduce this effect
The USCRN data set is from NOAA.
You've been pwned here, just admit it.
All of those charts use the same data and even all have the same NOAA logo on them for proof.
The CRN data is even overlaid on top of the weather station data to show that it corresponds but actually shows more warming.
You just fell for the Heartland Institute shite and aren't smart enough to follow the dots shown below, which shows your claims to be pure bullshit.
pwned.
Here's their original chart:
Its quite 'noisy' as it charts monthly data, which makes annual changes harder to see. Here's a version of the same data charting only annual changes:
And finally, here's that same CRN data overlaid on top of the NOAA's weather station data. Note that the discontinued CRN data matches quite well with the data that larue calls 'tainted'.
And if you calculate the trends based on that data, the CRN chart of US temp actually shows more warming than global changes and more changes than the 'tainted' data larue is trying ignore. Which pretty much kills that 'there is no warming' argument dead.
Trends (C per decade)
Global - 0.26
ClimDiv (US weather stations) - 0.19
US CRN - 0.31
This post comes from climatologist Zeke Hausfather, who took the time to rebut this stupid Heartland claim.
The full twitter thread is here.
https://twitter.com/hausfath/status/1169805837704937472
Man you sue are thorough I will give you that,lol. But I do intend to agree with you.You would not know real science if it whacked you up-side of your head
It is very disturbing to watch the lengths you will go o in order to deceive others
You need professional help
At the same time I'm sure you agree developing alternative energy sources will only help mankind and is necessary.
Here's a short video agreeing with your stance.
https://www.youtube.com/watch?v=mbc...S3citDG0txguVU-7Jd83QV6WCwFKRwOrszp2Jc98LvRuQ
eventuallyLets look at Frankfooters posts here
1
Link provided
no it wasn't, you still can't identify whether water vapour is a feedback or forcing effect. You failed.2
The error in his logic was pointed out
nope, see above3.
The error in his understanding was pointed out
Nope, I showed you how atmospheric warming melts Greenland ice which slows down the AMOC. As usual you failed to understand the point.4.
He tried to show the climate is driven by the oceans, without realizing this absolves CO2 as the culprit
Once this was pointed out he stayed away from this argument
You used NOAA data that is discontinued then called the data set they are now using 'tainted'. Which means you think NOAA data is suspect but you still quoted it. All I did was use the current data set and then overlaid it with the discontinued data Heartland used.5.
He added back the historical tainted data
Yes, because you stupidly claimed there was no correlation between CO2 and warming. I showed you wrong, again.6
Overlaid CO2 with some temp data & implied I was stupid
There is no equivalent winter accumulation, you are bullshitting.7.
Tried use summer Greenland melt as the evidence , while omitting the equivalent winter accumulation
Again, that data set is discontinued. Heartland picked it because they could use a cherry picked time and place (US, 15 years), use a noisy monthly chart and then fool the suckers who read their posts.8.
The dataset is 15 years old & is unque to the USA
One can not be cherry picking if one uses the entire data set
He repeats this Cheery picking argument many times desite having been shown this is not the case
See above.9.
The cherry picking accusation combined with the implication atmospheric temperatures are useless
Calls me stupid & adds in an implied oil industry connection for good measure
Wrong, I showed you how your cherry picking argument works by doing some cherry picking of my own, using arctic temps that showed 3.5ºC warming in the same time you said there was none. You had no answer to this and ignored it.10.
again with the cherry picking accusation, only he ties to back this up by cherry picking the arctic temp record
There is no uniqueness or significance, as shown by the overlaid chart. The data is now discontinued and was less accurate, showing even more warming than the new measurements11
More cherry picking accusations, Ignores the significance & uniqueness of the USCRN data set
more repetitions from larue12
Ignores the significance & uniqueness of the USCRN data set
he re-introduces the errors the USCRN was designed to omit
Its not non-existent, its discontinued, as it says on its site.13
Repeats a ridiculous attempt to dismiss the USCRN data set as non-existent despite this issue having been explained
Yes, unfortunately you're not bright enough to realize you lost the argument pages ago, so here we go again.14.
Pretty much summarises a series of absurd arguments which were addressed & claims victory
In a reply to someone else on a different point. Sheesh.15.
Introduces a chart from the 1800s , despite the real issue here is the past 15 years
I'll repeat the charts and points below, but this uses the same data set you claimed shows no warming, compares it with the new data and shows that the CRN data you like actually shows more warming.16
Quotes some blogger who cherry picked the USCRN data set and added back the tainted history
Anyone notice a pathological pattern of disorganized, desperate and plain illogical attempts to mislead others ?
Anyone recognize someone who is is in full blown panic mode?
The Greta thread has the same pattern, only he gets really aggressive about refuting the importance of atmospheric temperatures on the Greenhouse effect
His lack of scientific understanding is on full display
He also gets far more aggressive with the character assassinations in that thread
Trust is a very difficult thing to maintain if your objective is to mislead others
pwned, larue, you've been pwned.
All that whining, where there is no evidence you understand the science or the points made in the above post, just cement the facts.
Heartland posted a chart showing monthly temp changes in the US, which looks very 'noisy' and hides the fact that the chart actually does show an increase.
When you take that same data and smooth it out by inputting yearly change, as opposed to monthly, its clear that the discontinued CRN data actually shows more warming then the new ClimDiv data sets.
When this was pointed out to you, you went all mental 'cuz you couldn't argue the fact that you've been pwned.
The ramblings of a fool, who has been caught misleading others & is now in full blown panic modeHey, larue.
You've been pwned here, just admit it.
All of those charts use the same data and even all have the same NOAA logo on them for proof.
The CRN data is even overlaid on top of the weather station data to show that it corresponds but actually shows more warming.
You just fell for the Heartland Institute shite and aren't smart enough to follow the dots shown below, which shows your claims to be pure bullshit.
pwned.
New Video : Erasing America’s Hot Past
This video is a must-watch for people wanting to understand what is going on with the climate crisis scam. It shows what they are doing, how they are doing it, and what we need to do to prevent a hostile takeover of the corenerstone of our civilization - affordable, reliable energy.
https://www.youtube.com/watch?v=7Ag3D0rjGuc
agreedMan you sue are thorough I will give you that,lol. But I do intend to agree with you.
At the same time I'm sure you agree developing alternative energy sources will only help mankind and is necessary.
Here's a short video agreeing with your stance.
https://www.youtube.com/watch?v=mbc...S3citDG0txguVU-7Jd83QV6WCwFKRwOrszp2Jc98LvRuQ
I would be thrilled if an alternative economical viable energy source were developed
It would lift a great many people out of poverty
It is not necessary, as there is no climate catastrophe however the crayzies appear to have fooled the politicians
Unfortunately wind & solar are not going to get it done & attempts to scale these up to replace fossil fuels is a ridiculous fantasy & would cause a environmental nightmare
1. it would require a land mass the size of Russia
2. It would require massive amounts of copper, steal, aluminum, rare earth metals, plastics, solar grade silicon & lithium which require huge amounts of energy to mine and process. (Too bad the enviro nuts want to shut down the mining industry)
I doubt that much lithium and / or rare earth metals actually exists on the planet
3. Then there is the millions of miles of transmission lines required
4. Fossil fuels would still be required when the wind does not blow or when it is cloudy. This will be extremely inefficient
The stupidity of this idea is just staggering
A logical approach would be nuclear, but greenpeace is dead set against nuclear & they are ones running this show so......
Thorium molten salt reactors are much safer and do not create anywhere near the same amount of waste, but greenpeace is dead set against nuclear & they are ones running this show so.....
I totally dismantled your claim that there was no warming in the US, using data you linked to from NOAA, clear explanations and NOAA charts.The ramblings of a fool, who has been caught misleading others & is now in full blown panic mode
I pwned you.
