

“it’s coming, it’s just around the corner. Just any moment now. Just got off the phone. “
Cons sound like 12 year olds on a road trip. ARE WE THERE YET, ARE WE THERE YET? lol


“it’s coming, it’s just around the corner. Just any moment now. Just got off the phone. “
More like "Can we still afford this?"Cons sound like 12 year olds on a road trip. ARE WE THERE YET, ARE WE THERE YET? lol
it is a 5K gift to the rich
???
giving rich folks taxpayers money so they can buy a virtue signalling car is not strategic planning it is stupidity
perpetual deflects and unsustainable mountains of debt is not not strategic planning it is stupidity
More like "Can we still afford this?"
Scared of a 10 year old chart that uses readings that were updated because they didn't include orbital drift?
That's stupid.
Its you that is scared of the recent charts because it proves everything you say is a lie.
Same source, UAH, just the latest readings.
Makes your chart look like old bullshit.

Same source, UAH, just the latest readings.


1.55 C degrees per 100 years
that is equal to 0.155 C degrees per decade, exactly the same as the last UAH graph and inline with the slope of John Christy's 2027 graph, 0.14 C degrees
not at all close to the 0.28 C degrees per decade the climate models predicted
and ever further away from the impossible, not going to ever happen, RCP 8.5 which was 0.3 to 0.6 C degrees per decade
Incel life. You are on here non stop. You reply to everyone's post soon after they leave a comment. It's because you got nothing better to do with your free time. As for Trump you bicker about him so much I'm surprised your username isn't Rosie O'Donell. Only difference is she's been with women.That's amusing, did you get a SSHRC grants for a thesis on how to troll the libs, the joys of incel life or misinformation as mediation?
Or did your degree come from the back of a matchbook?
Though I think it more likely that you studied here:
That's the projection for warming in the troposphere, up in the clouds.


0.2ºC was the projection for warming on the surface of the planet, and we are higher than that.
you aren't bright enough to even understand that the temperature in the clouds is different than the temperature on the surface yet still think you are smarter than NASA.

unbelievable
again you did not look at the material you posted
again from your post
View attachment 547558
both data measurement and an empirical model with the same 0.155 C degrees / decade
the empirical model is not one of 102 CMIPS Models in Christy's 2017 graphic, those had an average slope of 0.28 C degrees per decade, almost 2X the actual
View attachment 547565
no
there is something wrong with the surface temperature record
- the climate model predictions were 0.28 C degrees/ decade - twice as fast
- it is not physically possible for the atmosphere to heat up the surface at a faster pace than the atmosphere itself
- the green house gas theory predicts the warming should occur in the troposphere
filled with errors
incomplete
biased by the urban island heat effect
has been fiddle with
you do not seem to understand the difference between a temperature and a temperature anomaly
lets just chuck that one onto the ever growing pile that you do not understand
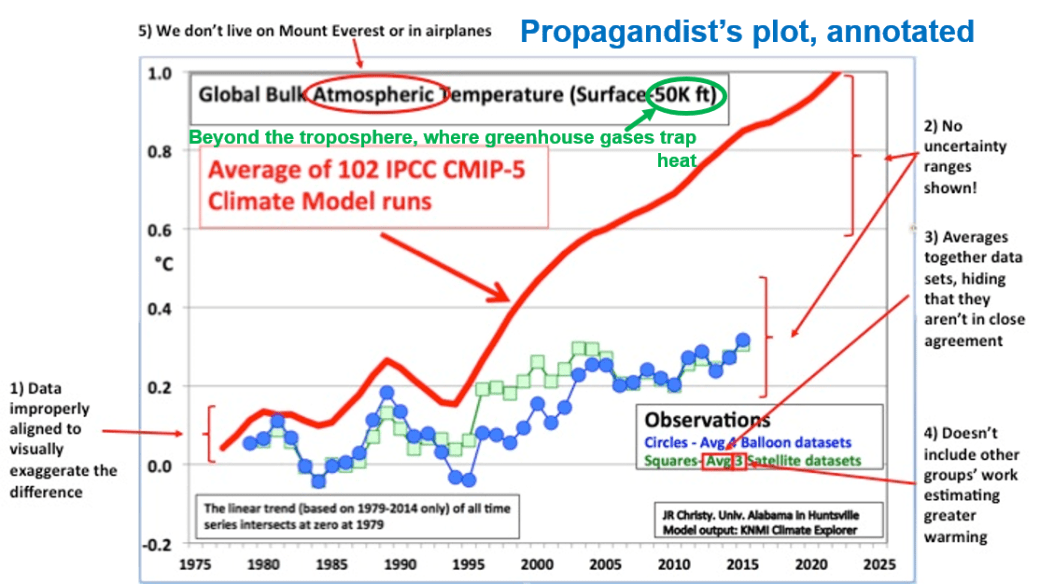
did you want a framed copy of the 2017 Christy Graphic ?
View attachment 547564

 www.theguardian.com
Troposphere - the temp in the clouds
AI Overview
Yes, the greenhouse gas theory (or Greenhouse Effect) predicts that warming will occur specifically in the
troposphere (the lowest layer of Earth's atmosphere, from the surface to about 10-15 km high).
The theory and associated climate models predict a distinct vertical pattern of temperature changes:
Bullshit, provide a link to this directly with the IPCC, not from Christy.
AI Overview
An empirical model is
a mathematical representation based solely on observed data, experiments, or real-world evidence rather than on theoretical principles or physical laws.
AI Overview
Canada's official climate modeling, led by the Canadian Centre for Climate Modelling and Analysis (CCCma), relies primarily on the Canadian Earth System Model (CanESM) series for global projections and the Canadian Regional Climate Model (CanRCM) for high-resolution studies. These models, notably CanESM2 and the newer CanESM5, analyze future climate scenarios for IPCC assessments.
nopeBullshit, the projections were for 0.2ºC per decade.


Provide a quote directly from the IPCC that backs this claim, not your interpretation of a 10 year old bullshit chart.
where the greenhouse gas theory predicts any warming should occurYour chart isn't even global, its 'Tropical'.
And its 'Mid - Troposphere' or the temp in the clouds.
AI Overview
Yes, the greenhouse gas theory (or Greenhouse Effect) predicts that warming will occur specifically in the
troposphere (the lowest layer of Earth's atmosphere, from the surface to about 10-15 km high).
The theory and associated climate models predict a distinct vertical pattern of temperature changes:
Its really quite telling that this is the only chart you can find now that you think defends your claim.
A 10 year old chart that was debunked from a source, the UAH, that corrected their readings to account for orbital drift.
These takedowns are a decade old, nobody else would use such obvious bullshit anymore.
This article is 10 years old, you won't read it and you can't understand the science enough to understand why Christy was humiliated by this chart.
Climate scientists just debunked deniers' favorite argument | Dana Nuccitelli
Dana Nuccitelli: And in the process, illustrated the difference between skepticism and denial
while pointing to satellite data setsDoes not include other groups work estimating greater warming
AI Overview
Yes, the greenhouse gas theory (or Greenhouse Effect) predicts that warming will occur specifically in the
troposphere (the lowest layer of Earth's atmosphere, from the surface to about 10-15 km high).
The theory and associated climate models predict a distinct vertical pattern of temperature changes:

where the greenhouse gas theory predicts any warming should occur
so you can store your '' temp in the clouds'' nonsense in dust bin as more uninformed , scientifically literate franken fool nonsense
god you are stupid
your scientific ignorance is on display once again
if roy spencer was going to display a modelers work he would have to reference the specific climate model eg CanESM2 or CanESM5
nope
View attachment 547799
trendlines crosses zero at zero at 1979 for all time series is clearly labelled
the average of the 102 CMIPS models predictions 3.2 decades latter 0.9 C degrees =0.28 C degrees / decade
the slope of the model predictions is consistent across multiple time frames
View attachment 547802
no
1. i do not take orders from morons
2, John Christy's work is accurate - he verified actual satellite observations vs multiple sets of INDEPENDENT weather balloon data sets
as of 20127 the climate model prediction is 0.28 C degrees / decade. which is way too hot vs the 0.14 or 0.156 C degrees/ decade observed in the troposphere
the climate crisis rhetoric has only intensified since 2017
and there has not been an oops sorry statement by the climate modellers indicating their projections have declined by 29% ((0.2-0.28)/0.28) =-29%
the climate model prediction is 0.28 C degrees / decade
so once again your high school drop out logic is wrong
where the greenhouse gas theory predicts any warming should occur
| January 2025 | 1.35°C | 76 |
| January 2024 | 1.31°C | 75 |
| January 2023 | 0.90°C | 68 |
| January 2022 | 0.93°C | 71* |
| January 2021 | 0.84°C | 66* |
| January 2020 | 1.17°C | 73 |
| January 2019 | 0.93°C | 71* |
| January 2018 | 0.85°C | 67 |
| January 2017 | 1.04°C | 72 |
| January 2016 | 1.20°C | 74 |
| January 2015 | 0.84°C | 66* |
| January 2014 | 0.75°C | 62 |
| January 2013 | 0.68°C | 60* |
| January 2012 | 0.51°C | 51* |
| January 2011 | 0.55°C | 54* |
| January 2010 | 0.76°C | 63 |
| January 2009 | 0.67°C | 58 |
| January 2008 | 0.28°C | 34* |
| January 2007 | 0.92°C | 69 |
| January 2006 | 0.60°C | 56* |
| January 2005 | 0.77°C | 64 |
| January 2004 | 0.62°C | 57 |
| January 2003 | 0.71°C | 61 |
| January 2002 | 0.68°C | 60* |
| January 2001 | 0.46°C |
| January 2025 | 1.35°C | 76 |
| January 2024 | 1.31°C | 75 |
| January 2023 | 0.90°C | 68 |
| January 2022 | 0.93°C | 71* |
| January 2021 | 0.84°C | 66* |
| January 2020 | 1.17°C | 73 |
| January 2019 | 0.93°C | 71* |
| January 2018 | 0.85°C | 67 |
| January 2017 | 1.04°C | 72 |
| January 2016 | 1.20°C | 74 |
| January 2015 | 0.84°C | 66* |
| January 2014 | 0.75°C | 62 |
| January 2013 | 0.68°C | 60* |
| January 2012 | 0.51°C | 51* |
| January 2011 | 0.55°C | 54* |
| January 2010 | 0.76°C | 63 |
| January 2009 | 0.67°C | 58 |
| January 2008 | 0.28°C | 34* |
| January 2007 | 0.92°C | 69 |
| January 2006 | 0.60°C | 56* |
| January 2005 | 0.77°C | 64 |
| January 2004 | 0.62°C | 57 |
| January 2003 | 0.71°C | 61 |
| January 2002 | 0.68°C | 60* |
| January 2001 | 0.46°C |
www.theguardian.com
were you not able to find a debunk story on the sesame street journal of science ?
lets address the Guardian attempt at critique
1. as stated in the Christy graphic - 5year averages , 1979-2016 trend line crosses zero at 1979 for all time series
2. uncertainty range ???? look at the spaghetti mess of the models if you want an uncertainty estimate
3 there are two separate averages of 3 and 4 Independent balloon data sets both align to the satellite measurements . This is called VERIFICATION
# 4. is especially telling
what ever gradian fool did this hit job he/ she did not understand what they were attacking
while pointing to satellite data sets
the satellite data sets do not estimate warming, the satellite data sets are actual measurements
#5
next time go get some real scientific analysis and use the Guardian for its real purpose, lining the bottom of bird cages
did you want a framed version of the 2017 Christy graphic?
it would look nice hanging on your wall where a diploma should hang, had you not dropped out of high school
View attachment 547831
the satellite data sets do not estimate warming, the satellite data sets are actual measurements
It's not her first time on the show. She has smartened up by not saying much.This may be triggering to Righties and Putin lovers, but she's awesome, isn't she???
Making it on the Maher show, shes moving on up!!!
I suspect Chris wanted to eat Chrystia
It's not her first time on the show. She has smartened up by not saying much.
I bet her weight gain was tax payer funded. She's as big as Chris.Dammit, I missed the other appearance. She has put on some weight over the last year.
Chris is a pro in front of the cameras, she's nervous but with time that can change.
I bet her weight gain was tax payer funded. She's as big as Chris.

The correct phrase should be 'where the greenhouse gas theory predicts some warming should occur'.
AI Overview
Yes, the greenhouse gas theory (or Greenhouse Effect) predicts that warming will occur specifically in the
troposphere (the lowest layer of Earth's atmosphere, from the surface to about 10-15 km high).
The theory and associated climate models predict a distinct vertical pattern of temperature changes:


Is the 'Mid Troposphere' the same as the surface to you?take your idiotic high school drop out ,pseudo logic up with AI
Yes, the greenhouse gas theory (or Greenhouse Effect) predicts that warming will occur specifically in the
troposphere (the lowest layer of Earth's atmosphere, from the surface to about 10-15 km high).


