The Porn Dude

Is global climate policy actually about global income redistribution ?

Status
Not open for further replies.

Moviefan-2

Court Jester
Oct 17, 2011
10,489
171
63
In May of last year the two of us did the same calculations together to come up with the number we agreed to bet on, 0.83. We both agreed the bet was on 2015 hitting 0.83C until you started losing....
Not quite.

It is true that we both agreed in May 2015 that we were betting on a temperature increase of 0.15ºC over the previous year (the remaining difference at that time from the IPCC prediction of a 0.40ºC increase over two decades). It is also true that in May 2015, we agreed that adding 0.15ºC to the reported 2014 anomaly (at that time) of 0.68ºC produced a bet of 0.83ºC.

There is no dispute that we bet on a year-over-year increase of at least 0.15ºC.
It was a year-over-year increase of 0.15ºC of the 2014 anomaly from the time of the bet.
What actually happened later was that NASA announced in July 2015 that it had changed all of its data, based on the NOAA changes to the sea surface temperatures.

While the 0.15ºC increase that we bet on was unaffected (since the current years were all adjusted the same way), the hard numbers changed.

Frankfooter insists the graph we should be using is the one that shows a 0.74ºC temperature anomaly for 2014.

Furthermore, Frankfooter maintains that you get the same hard number for the bet when you add the 0.15ºC increase to the currently reported 2014 anomaly of 0.74ºC. He says 0.74ºC plus 0.15ºC still adds up to 0.83ºC.

I say his calculations are wrong.
 

fuji

Banned
Jan 31, 2005
80,011
7
0
¯\_(ツ)_/¯
is.gd
In terms of climate what do you consider a long term trend? The instrumental global temperature record is 166 years old. That is but a blip in the history of climate. So in reality it is the AGW alarmists who are the biggest cherry pickers, wouldn't you agree?
If I run regressions, when I add enough years to get a result within a 95 perecent confidence interval, the trend will be up. From this thread and others I know you don't think about this problem from a statistical perspective, but anybody serious does.

If you like I can load all those numbers into a spreadsheet and calculate confidence intervals for whatever number of years back you would like. Small numbers of years won't produce a significant result, long enough to produce significance will show warming.
 

Frankfooter

dangling member
Apr 10, 2015
91,113
21,996
113
You stated
Lets take a look at the two posts you used for your quotes, using quotes from the very same posts.
Instead you fixated on the difference between 2014's temperature and the bet
But the terms of the bet were clear, they were based on the global anomaly hitting 0.83ºC, not 0.83ºC + 'whatever it takes to make moviefan win'.
The first of those posts was dedicated to showing that your fixation on 2014's temperature was not part of the bet. The second of those posts was dedicated to confirming that the bet was made on 0.83ºC, not a moving number that you could adjust at will.

Those were posts where I was stating specifically that your claim about changing a bet based on 1995-2015 into a bet based on 2014 retroactively because you lost was just more of your bullshit.

You are a lying weasel, lets look at your lies.

1)
the reality is that you have calculated that 0.74 + 0.15 = 0.83.
Never stated those numbers, never made that claim.
All you can produce are separate posts, all of which directly dispute your claim as noted above in this thread.

2)
Indeed. In the 21st century, the Earth's temperature has been stagnant
And then you pasted in a chart from an article that says nothing of the sort, lying about that article.

3)
The "0.83" quotes you cited from me refer to an entirely different graph with completely different numbers. .
The 0.83ºC number comes from our bet and the chart or numbers referenced have been to the live chart published by NASA as noted by you in the original bet.
http://climate.nasa.gov/vital-signs/global-temperature/

If that's the chart you're saying will hit 0.83 at the end of 2015, we definitely have a bet.
It is you that refers to other, older and out of date charts.
I referred to numbers from that link.
Another lie.

4)
What actually happened later was that NASA announced in July 2015 that it had changed all of its data, based on the NOAA changes to the sea surface temperatures.
They didn't change 'all their data', they updated some sea surface measurements based new information about old measurements. We had this discussion in June of last year after the changes and you agreed to continue the bet on the original number, 0.83. This quote is after those discussions (check the link). Every attempt to change the terms of the bet is another lie that you would honour your word.
In any event, it's settled. The bet that you and I made on May 10, 2015, stands.
You lie when you said that the bet stands as it is every time you use the number 0.74 (which comes from your attempt to change the bet to a different bet based on 2014-2015) instead of the 0.83 that we agreed on.

5)
It is also true that in May 2015, we agreed that adding 0.15ºC to the reported 2014 anomaly (at that time) of 0.68ºC produced a bet of 0.83ºC.
That is not how we 'produced' the bet, the bet was made off of IPCC projections from 1995-2015.
Therefore, the bet is from 1995 to 2015 -- you won't have to wait, as we'll know the winner by early 2016.

Do we have a bet?
You posted a graph that showed a 0.43ºC anomaly for 1995 and we agreed to bet on whether there would be a minimum increase of 0.4ºC over 20 years.

So we bet on the remaining distance from the original 1995 anomaly of 0.43ºC.
That is how we 'produced' the bet.
You lied.

Your continual lying is getting out of control.
The bet was based on 1995-2015, not 2014-2015.
You agreed to use 0.83ºC as the final number of the bet.
You agreed to not change that number in June of last year after the NOAA 'data changes' as you call them.


This is all what you call 'numerical changes produced retroactively through changes in methodology'
The bet was based on the IPCC's predictions of temperature increases of 0.2ºC per decade, not numerical changes produced retroactively through changes in methodology.

You are a lying weasel.
 
Last edited:

jcpro

Well-known member
Jan 31, 2014
24,673
6,840
113
In terms of climate what do you consider a long term trend? The instrumental global temperature record is 166 years old. That is but a blip in the history of climate. So in reality it is the AGW alarmists who are the biggest cherry pickers, wouldn't you agree?
That's exactly where the climate alarmists turn off all of my interest. We can see it on this board where people argue over 0.15 of a degree. Ridiculous. Yes, the climate is changing. It's always been changing and it will continue to change until the Earth is absorbed by the expanding Sun.
 

Frankfooter

dangling member
Apr 10, 2015
91,113
21,996
113
That's exactly where the climate alarmists turn off all of my interest. We can see it on this board where people argue over 0.15 of a degree. Ridiculous. Yes, the climate is changing. It's always been changing and it will continue to change until the Earth is absorbed by the expanding Sun.
It does change, but the natural changes tend to be very slow, while we have changed it nearly 2ºC over the last century and a bit. Historically that's a big and very fast change.
Just because ice ages and thermal maximums are natural doesn't mean you want to make one happen.
 

jcpro

Well-known member
Jan 31, 2014
24,673
6,840
113
It does change, but the natural changes tend to be very slow, while we have changed it nearly 2ºC over the last century and a bit. Historically that's a big and very fast change.
Just because ice ages and thermal maximums are natural doesn't mean you want to make one happen.
Actually, you don't know that. Nobody does because accurate temperature records are not available. All we know for sure is that we're in between ice ages. We are not even certain what triggers ice ages, neither can we predict them. BTW, the cooling is a civilization retarding event while warming is not. For that, we have historical and paleontological records.
 

Moviefan-2

Court Jester
Oct 17, 2011
10,489
171
63
The 0.83ºC number comes from our bet and the chart or numbers referenced have been to the live chart published by NASA as noted by you in the original bet.
This is an admission that you are bullshitting and that you have violated the terms of the bet.

The terms were clear -- you get to use one graph. From May 11, 2015:

We might get a bet, once you agree to use one chart for recording the results.
The 0.83 calculation came from the pre-adjusted graph, while the "live chart" that you are saying you want to use for determining the 2015 anomaly is a completely different graph with completely different numbers.

That's two graphs, Franky. Not one.

You lie when you said that the bet stands as it is every time you use the number 0.74 (which comes from your attempt to change the bet to a different bet based on 2014-2015) instead of the 0.83 that we agreed on.
The 0.74ºC anomaly for 2014 is your number. It comes from the "live chart" that you're insisting we use to determine who won the bet.

Unless you're prepared to make adjustments (which you insist you won't), you have to use the same graph for all of the data, Franky. That's how you measure data properly. It's also something you committed to do when you accepted the bet. That means using the same graph for the 2014 anomaly and the 2015 anomaly.

Contrary to your months of bullshit, I haven't changed anything. We bet on a 0.15ºC increase last May. I have stuck with that number. The only numbers that have changed are NASA's numbers.

If you're going to insist on using the "live chart" that shows a 0.87ºC anomaly for 2015, then your number for the 2014 anomaly is 0.74ºC. They both come from the same "live chart."

To determine whether or not the temperature increase in 2015 fulfilled the IPCC's predictions, you add the 0.15ºC increase from the bet to the 2014 anomaly. Since you insist we're using the "live chart" and a 2014 anomaly of 0.74ºC, that means adding 0.15ºC to 0.74ºC.

You keep saying that adds up to 0.83ºC.

Your calculation is wrong.
 

Frankfooter

dangling member
Apr 10, 2015
91,113
21,996
113
The 0.83 calculation came from the pre-adjusted graph, while the "live chart" that you are saying you want to use for determining the 2015 anomaly is a completely different graph with completely different numbers.

That's two graphs, Franky. Not one.
No, you lying weasel.
The chart is one and the same, and its published here:
http://climate.nasa.gov/vital-signs/global-temperature/

That is the chart we used to calculate the fixed number we used for the bet, but only a total idiot like you would claim that reference to a live updated chart is invalid because it is live and was updated. Same chart, same address. The chart had to be live in order for it to be updated with 2015's temperature. That they update the chart and methodology is common knowledge, so common that those points are included in their FAQ's. Only a total idiot wouldn't do their own research before they take a bet and wouldn't know that they update their figures continually as they refine their work.

Does data processing make temperature data warmer?
It can go either way. Almost half of NOAA's corrected data are cooler than the original records. NOAA's corrections of temperatures over the oceans — done to compensate for changes in methods of observing the temperature of water at the surface of the ocean — reduced the warming trend in global temperature.
http://climate.nasa.gov/faq/

We bet on a 0.15ºC increase last May. I have stuck with that number.
No we didn't, that is a lie you repeat over and over again because you lost. Here is a quote that directly contradicts what you say and exposes you as a liar.
You posted a graph that showed a 0.43ºC anomaly for 1995 and we agreed to bet on whether there would be a minimum increase of 0.4ºC over 20 years.

So we bet on the remaining distance from the original 1995 anomaly of 0.43ºC.
That is what we bet on, not a year to year increase, you lying weasel.

The only legit argument you could make for 'adjusting the bet' would be to insist that we the bet continued to use the same method for the calculations using the updated figures. But even doing that you'd lose the bet, so you keep having to try this weasel, Dunning-Kruger idiocy that the bet wasn't based on 1995-2015 temperatures but was instead your lying claim that it was based on 2014-2015. NASA updated the numbers for 1995 to 0.46ºC from the 0.43ºC we bet on, but adding on the 0.40ºC for the two decades projected increase we bet on would still make you lose since 2015 came in at 0.87ºC, beating even the updated 0.86ºC. That's why you keep on trying to claim that the bet was based on adding your year over year increase from 2014. Its a totally dishonest, weasel move.

This is your weasel logic:
To determine whether or not the temperature increase in 2015 fulfilled the IPCC's predictions, you add the 0.15ºC increase from the bet to the 2014 anomaly. Since you insist we're using the "live chart" and a 2014 anomaly of 0.74ºC, that means adding 0.15ºC to 0.74ºC.

You keep saying that adds up to 0.83ºC.
But its a lie, you stated totally calculations for the bet up and until you lost.
The bet was based on the IPCC's predictions of temperature increases of 0.2ºC per decade, not numerical changes produced retroactively through changes in methodology.
You continue to try to get away with what you call 'numerical changes produced retroactively through changes in methodology.'

Just stop being such a lying weasel and admit you lost.
 

K Douglas

Half Man Half Amazing
Jan 5, 2005
27,216
7,851
113
Room 112
If I run regressions, when I add enough years to get a result within a 95 perecent confidence interval, the trend will be up. From this thread and others I know you don't think about this problem from a statistical perspective, but anybody serious does.

If you like I can load all those numbers into a spreadsheet and calculate confidence intervals for whatever number of years back you would like. Small numbers of years won't produce a significant result, long enough to produce significance will show warming.
What numbers? Really the only true accurate numbers we have are the satellite records which have only existed since 1979. That's 36 years of data. The climate is millions of years old. But for arguments sake use the surface temperature records that have existed since 1850. They are flawed and only cover a small portion of the earth. Run them and you will see that it will be less than the folks at NASA, NOAA, Hadley Ctr are saying. They haven't used the raw data, they've made adjustments to it. And still they are showing less than 1 degree celsius of warming.

I'll believe the raw data and the satellite data which show about 0.45 degree celsius of warming. Bottom line - there is no significant warming. There is no crisis.
 

K Douglas

Half Man Half Amazing
Jan 5, 2005
27,216
7,851
113
Room 112
It does change, but the natural changes tend to be very slow, while we have changed it nearly 2ºC over the last century and a bit. Historically that's a big and very fast change.
Just because ice ages and thermal maximums are natural doesn't mean you want to make one happen.
2 degrees celsius. Nice try. Try 0.8 degrees celsius (I believe even less since this is adjusted data). Oh my God we're burning up :)
 

Frankfooter

dangling member
Apr 10, 2015
91,113
21,996
113
What numbers? Really the only true accurate numbers we have are the satellite records which have only existed since 1979.
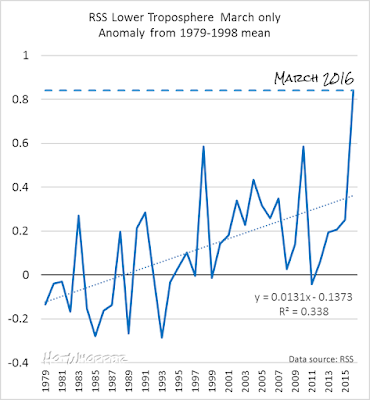
Satellite data isn't as reliable as surface temperatures, not to mention the fact that satellites don't measure surface temperature at all, they measure the temperature up in the atmosphere, which is only really appropriate for those who live in the clouds.

But if you insist, take a look at the data from satellites:


Frankfooter

dangling member
Apr 10, 2015
91,113
21,996
113
2 degrees celsius. Nice try. Try 0.8 degrees celsius (I believe even less since this is adjusted data). Oh my God we're burning up :)
February's temperature hit 2ºC from pre-industrial times, using Michael Mann's baseline of 1750-1850 as pre-industrial.
Michael E. Mann ‎@MichaelEMann

Yes, Feb 2016 saw 2C warmer-than-preindustrial "dangerous" warming: https://twitter.com/MichaelEMann/status/708811624891613185

7:37 PM - 12 Mar 2016 · San Diego, CA, United States
 

fuji

Banned
Jan 31, 2005
80,011
7
0
¯\_(ツ)_/¯
is.gd
What numbers? Really the only true accurate numbers we have are the satellite records which have only existed since 1979. That's 36 years of data. The climate is millions of years old. But for arguments sake use the surface temperature records that have existed since 1850. They are flawed and only cover a small portion of the earth. Run them and you will see that it will be less than the folks at NASA, NOAA, Hadley Ctr are saying. They haven't used the raw data, they've made adjustments to it. And still they are showing less than 1 degree celsius of warming.

I'll believe the raw data and the satellite data which show about 0.45 degree celsius of warming. Bottom line - there is no significant warming. There is no crisis.
The ones MF and Frank are yammering about. If you run regressions with year as the x1 term and y as the temperature you will get one of two outcomes depending on the number of years you include: not enough data to predict a value for x1 with 95% confidence, or a positive value for x1. In any case the residual term will be large relative to the value for x1.
 

Moviefan-2

Court Jester
Oct 17, 2011
10,489
171
63
February's temperature hit 2ºC from pre-industrial times, using Michael Mann's baseline of 1750-1850 as pre-industrial.
So, it goes from about 1ºC to 2ºC if you add another 100 years or so to the back end.

In other words, K Douglas was right.
 

Moviefan-2

Court Jester
Oct 17, 2011
10,489
171
63
No, you lying weasel.
The chart is one and the same, and its published here:
http://climate.nasa.gov/vital-signs/global-temperature/
Is that so?

Well, in that case, since we're both agreed the bet represented a 0.15ºC year-over-year increase in 2015, you must believe the bet can be determined by adding 0.15ºC to the 2014 anomaly. That must be true if it's "one and the same" graph as the one we bet on.

It was a year-over-year increase of 0.15ºC of the 2014 anomaly from the time of the bet.
(BTW, you might want to take a closer look at that "remaining distance" quote of mine that you cited so approvingly -- the "remaining distance" being the difference between 0.25ºC and 0.40ºC. :biggrin1:)

According to your "one and the same" live graph, the 2014 anomaly was 0.74ºC. What do we get when we add 0.15ºC to 0.74ºC?

You repeatedly say the answer is 0.83ºC.

Your calculation is wrong.
 

Moviefan-2

Court Jester
Oct 17, 2011
10,489
171
63
You posted a graph that showed a 0.43ºC anomaly for 1995 and we agreed to bet on whether there would be a minimum increase of 0.4ºC over 20 years.

That same graph proclaimed that 2014 was the warmest year on record at 0.68ºC -- an increase of 0.25ºC from the 1995 anomaly.

So we bet on the remaining distance from the original 1995 anomaly of 0.43ºC.

Using your 1995 anomaly as the starting point and the bet of a 0.40ºC increase, tell us what number you get when you subtract 0.25 from 0.40. :thumb:
That is what we bet on, not a year to year increase, you lying weasel.
Too funny. Frankfooter says the difference between 0.25ºC and 0.40ºC is -- in his exact words -- "what we bet on." Apparently, he hasn't figured out yet that 0.40ºC - 0.25ºC = 0.15ºC.

To repeat his words: "That is what we bet on."

Indeed. :thumb:
 

Frankfooter

dangling member
Apr 10, 2015
91,113
21,996
113
Is that so?

Well, in that case, since we're both agreed the bet represented a 0.15ºC year-over-year increase in 2015,
But the terms of the bet were clear, they were based on the global anomaly hitting 0.83ºC, not 0.83ºC + 'whatever it takes to make moviefan win'.
The quote you used in your post comes from a post where I was calling you out for lying that the bet was year over year instead of decadal, the quote above comes from the same post. You are acting like a weasel and trying to misquote me.

We did not bet on a year over year increase of 0.15ºC, liar.
We bet on there being a 0.40ºC increase from 2015, not your weasel lie of a year over year increase.
You posted a graph that showed a 0.43ºC anomaly for 1995 and we agreed to bet on whether there would be a minimum increase of 0.4ºC over 20 years.

So we bet on the remaining distance from the original 1995 anomaly of 0.43ºC.
You are calling yourself a liar.

For confirmation, read the posts up to where you lied and said you'd agree to the terms of the bet, based on a 1995-2015 term, not a year over year bet.


Its not about 'backdating' the predictions.

You claim that the IPCC prediction of 0.2ºC is 'spectacularly wrong'.
That prediction was based on longer term time scale, all I'm doing is keeping the bet to the terms of the IPCC predictions.
I'll take a longer term prediction, and I'm saying I'm not interested in making a bet with you starting from 1990 because it doesn't come to term for another 5 years.

But I will take a bet that comes to term next year or the year after.
So lets use the IPCC's terms, the 0.2ºC per decade over 3 decades coming into term next year or the year after.

Tell you what, I'll go as far as this comprise for you.
Lets use 1996 - 2016 as our term for this bet?
That's two decades, the IPCC prediction you call spectacularly wrong, with an average increase of 0.2ºC per decade.

Will you take that bet?

What's the matter, too afraid you're going to lose?
Now, we're getting somewhere.

But the IPCC prediction at that time was made in 1995, not 1996.

Therefore, the bet is from 1995 to 2015 -- you won't have to wait, as we'll know the winner by early 2016.

Do we have a bet?
Nope.
My terms are either:
1985 for 3 decades @ 0.2ºC increase average per decade
1986 for 3 decades @ 0.2ºC increase average per decade

or
1996 for 2 decades @ 0.2ºC increase average per decade

Why won't you take them?
Cherry picking issues?

If you think the IPCC work is crap, then it shouldn't matter in the least which date you take?
Why won't you take those dates?

Is it because of cherry picking, your argument only works on one or two years?

C'mon take the bet.
The IPCC report was released in 1995. The only way to make it fair and to avoid any concerns about "cherry picking" is to use 1995 as the starting date.

Otherwise, I might be more inclined to pick 1997 or 1998 as the starting dates.

But we can't cherry pick. The only way to make it fair is to pick 1995 as the starting date.

Do we have a bet?
You are a lying weasel.
You lost the bet and are lying your pants off to avoid paying up.
Loser.
 

Frankfooter

dangling member
Apr 10, 2015
91,113
21,996
113
Too funny. Frankfooter says the difference between 0.25ºC and 0.40ºC is -- in his exact words -- "what we bet on."
Nope, you are a lying weasel.
The quote you used referred to this quote from you, which accurately describes the bet and shows that you are lying.
You posted a graph that showed a 0.43ºC anomaly for 1995 and we agreed to bet on whether there would be a minimum increase of 0.4ºC over 20 years.

So we bet on the remaining distance from the original 1995 anomaly of 0.43ºC.
You are still lying.
 

Moviefan-2

Court Jester
Oct 17, 2011
10,489
171
63
The quote you used referred to this quote from you, which accurately describes the bet....
Exactly!

And the "remaining distance" from the end of 2014 to the end of 2015 was the difference between 0.25ºC and 0.40ºC. It worked out to an increase over 2014 of 0.15ºC.

As you say, that "accurately describes the bet." Or, as you also said: "That is what we bet on." (Emphasis added by me.)

Well said, Frankfooter.

Here's the problem: I continue to reject your calculation that 0.74ºC + 0.15ºC = 0.83ºC.

(By the way, you know I'm going to add your quote about how I am "still lying" about 0.40 minus 0.25 equalling 0.15 to your greatest hits. :thumb:)
 

Frankfooter

dangling member
Apr 10, 2015
91,113
21,996
113
Exactly!

And the "remaining distance" from the end of 2014 to the end of 2015 was the difference between 0.25ºC and 0.40ºC. It worked out to an increase over 2014 of 0.15ºC.

As you say, that "accurately describes the bet." Or, as you also said: "That is what we bet on." (Emphasis added by me.)
No, this 'remaining distance' was on observation on numbers at the time of the bet, it wasn't what we bet on. You keep fixating on this distance because you lost the bet, and this Dunning-Kruger effect claim is all you've got left. Its like you bet on the Leafs to win the cup and you noted that at the time of the bet they had two goalies, then after they were the worst in the league you claim you won the bet because they still have two goalies. It was an observation, not a condition of the bet.

In post #120 and #117 you lied like a weasel again. You intentionally lied about a quote of mine, claiming I was confirming this Dunning-Kruger bullshit year over year nonsense when I was referring to a quote that exposes you as lying about the terms of the bet.

Your lying is getting worse and worse.

We never agreed that the bet was a year over year bet.

The only quote you ever use states the exact opposite of what you claim, it describes the terms of the bet and notes the 'observation' about 2014 and that the 'observation' was not part of the bet.

Once again, you are trying to change a bet based on 1995-2015 into a bet based on 2014-2015 because you lost and you'd prefer to lie like a weasel rather then admit how incredibly stupid you are.

Here are the series of posts where we discussed and set the terms of the bet, all discussions were around decadal dates, not one single reference to year over year terms.
Stop lying like a weasel, loser.

Its not about 'backdating' the predictions.

You claim that the IPCC prediction of 0.2ºC is 'spectacularly wrong'.
That prediction was based on longer term time scale, all I'm doing is keeping the bet to the terms of the IPCC predictions.
I'll take a longer term prediction, and I'm saying I'm not interested in making a bet with you starting from 1990 because it doesn't come to term for another 5 years.

But I will take a bet that comes to term next year or the year after.
So lets use the IPCC's terms, the 0.2ºC per decade over 3 decades coming into term next year or the year after.

Tell you what, I'll go as far as this comprise for you.
Lets use 1996 - 2016 as our term for this bet?
That's two decades, the IPCC prediction you call spectacularly wrong, with an average increase of 0.2ºC per decade.

Will you take that bet?

What's the matter, too afraid you're going to lose?
Now, we're getting somewhere.

But the IPCC prediction at that time was made in 1995, not 1996.

Therefore, the bet is from 1995 to 2015
-- you won't have to wait, as we'll know the winner by early 2016.

Do we have a bet?
Nope.
My terms are either:
1985 for 3 decades @ 0.2ºC increase average per decade
1986 for 3 decades @ 0.2ºC increase average per decade

or
1996 for 2 decades @ 0.2ºC increase average per decade

Why won't you take them?
Cherry picking issues?

If you think the IPCC work is crap, then it shouldn't matter in the least which date you take?
Why won't you take those dates?

Is it because of cherry picking, your argument only works on one or two years?

C'mon take the bet.
The IPCC report was released in 1995. The only way to make it fair and to avoid any concerns about "cherry picking" is to use 1995 as the starting date.

Otherwise, I might be more inclined to pick 1997 or 1998 as the starting dates.

But we can't cherry pick. The only way to make it fair is to pick 1995 as the starting date.

Do we have a bet?
And this was the bet.
So in order to win the bet, all the temperature has to do is hit 0.83ºC anomaly for the year of 2015, correct?
http://climate.nasa.gov/vital-signs/global-temperature/

If that's the chart you're saying will hit 0.83 at the end of 2015, we definitely have a bet.
 
Status
Not open for further replies.
Toronto Escorts