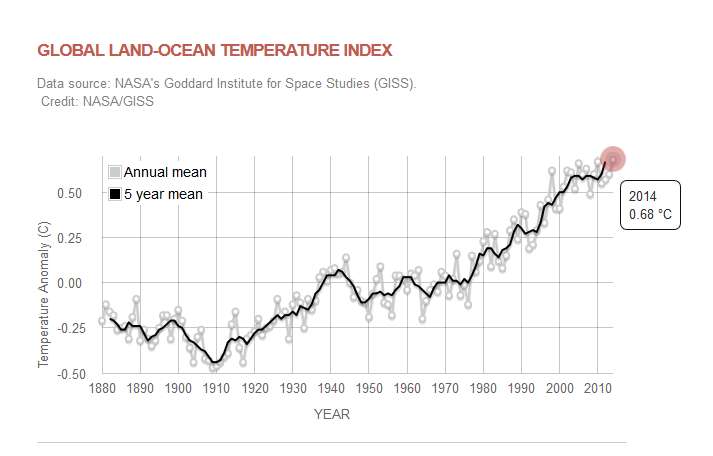
In May, 201(5), we bet whether or not the IPCC projection of 0.2ºC was accurate, from 1995-2015, based on the reported 1995 global temperature anomaly of 0.43ºC.

"0.43ºC"? :Eek:
In May, 201(5), we bet whether or not the IPCC projection of 0.2ºC was accurate, from 1995-2015, based on the reported 1995 global temperature anomaly of 0.43ºC.

Are you calling yourself a liar?"0.43"? :Eek:
Still trying to find ways to cheat the bet, aren't you?You posted a graph that showed a 0.43ºC anomaly for 1995 and we agreed to bet on whether there would be a minimum increase of 0.4ºC over 20 years.
So we bet on the remaining distance from the original 1995 anomaly of 0.43ºC.
Are you calling yourself a liar?
In July 2015, NASA announced it was using some controversial sea-surface temperature adjustments calculated by NOAA and completely rewrote the graph. Many of us would argue there was a lot of monkey business involved.
(W)e bet whether or not the IPCC projection of 0.2ºC was accurate, from 1995-2015, based on the reported 1995 global temperature anomaly of 0.43ºC.

No math is needed, you can keep your broken abacus out of this.
Yes, as you noted repeatedly, we bet made a bet on 0.83ºC for the year 2015."0.43ºC"? :Eek:The fact that it was a year-over-year increase of 0.15ºC of the 2014 anomaly from the time of the bet had nothing to do with the bet. The terms of the bet were clear, they were based on the global anomaly hitting 0.83ºC, not 0.83ºC + 'whatever it takes to make moviefan win'.
You agreed to continue the bet on its original terms, not to change the terms to your 'adjusted' numbers.
You posted a graph that showed a 0.43ºC anomaly for 1995 and we agreed to bet on whether there would be a minimum increase of 0.4ºC over 20 years.
So we bet on the remaining distance from the original 1995 anomaly of 0.43ºC.
So in order to win the bet, all the temperature has to do is hit 0.83ºC anomaly for the year of 2015, correct?
http://climate.nasa.gov/vital-signs/global-temperature/
If that's the chart you're saying will hit 0.83 at the end of 2015, we definitely have a bet.
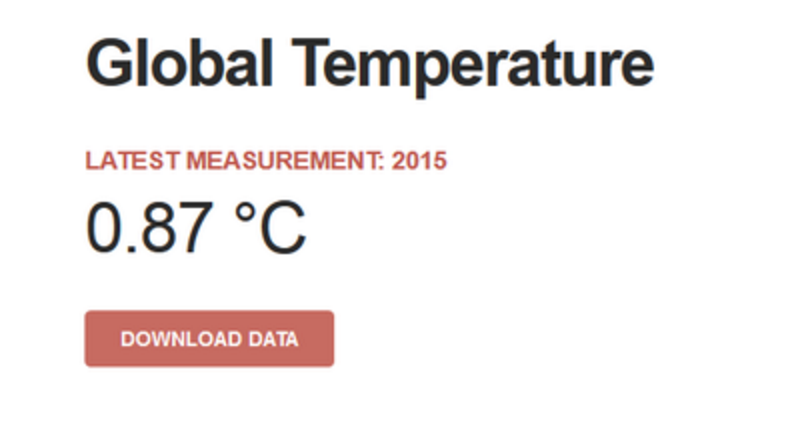
NASA reported:
- 2015 anomaly: 0.87ºC

0.43ºC was the reported global temperature for 1995 + (0.2ºC X 2 decades) for our bet of 0.83ºC.
(W)e had this discussion during the bet and he twice confirmed he would continue the bet with the new NASA numbers.
We both agreed to use this chart:
http://climate.nasa.gov/vital-signs/global-temperature/

It takes a certain kind of person to post something that shows himself to be a lying fool.
0.43ºC correct."0.43ºC"? :Eek:
Yes, as you noted repeatedly, we bet made a bet on 0.83ºC for the year 2015.You posted a graph that showed a 0.43ºC anomaly for 1995 and we agreed to bet on whether there would be a minimum increase of 0.4ºC over 20 years.
So we bet on the remaining distance from the original 1995 anomaly of 0.43ºC.
0.43ºC was the reported global temperature for 1995 + (0.2ºC X 2 decades) for our bet of 0.83ºC.
(W)e had this discussion during the bet and he twice confirmed he would continue the bet with the new NASA numbers.
We both agreed to use this chart:
http://climate.nasa.gov/vital-signs/global-temperature/

:Eek:0.43ºC correct.
It takes a certain kind of person to post something that shows himself to be a lying fool.
I am glad you agree that we based our bet on the NASA 1995 report of 0.43ºC, at the time of the bet."0.43ºC"?
:Eek:
The adjusted bet is 0.86 degrees Celsius.
That works out to an average for the year of 0.766ºC
If you want to propose a revised bet of 0.89ºC, you might get an agreement.
And 0.745ºC is nowhere near the IPCC "projection" of 0.85ºC for 2015
You can't even keep your cheating numbers straight, each time you try to cheat you come up with a different number.0.75 + 0.82 + 0.84 + 0.71 + 0.71 is 0.766 is "denier math"
So many fails from you on this bet.In any event, it's settled. The bet that you and I made on May 10, 2015, stands.
Therefore, the bet is from 1995 to 2015 -- you won't have to wait, as we'll know the winner by early 2016.
Do we have a bet?
So in order to win the bet, all the temperature has to do is hit 0.83ºC anomaly for the year of 2015, correct?
http://climate.nasa.gov/vital-signs/global-temperature/
If that's the chart you're saying will hit 0.83 at the end of 2015, we definitely have a bet.
NASA reported:
- 2015 anomaly: 0.87ºC

And you even promised to keep to the original bet with the original terms....
???? :crazy:(W)e had this discussion during the bet and he twice confirmed he would continue the bet with the new NASA numbers.
It takes a certain kind of person to post something that shows himself to be a lying fool.
Stoooopid.
We both agreed to use this chart:
http://climate.nasa.gov/vital-signs/global-temperature/
(W)e bet whether or not the IPCC projection of 0.2ºC was accurate, from 1995-2015, based on the reported 1995 global temperature anomaly of 0.43ºC.

:Eek:0.43ºC correct.
It takes a certain kind of person to post something that shows himself to be a lying fool.
New numbers = including the rest of 2015's data.Contradiction 101
???? :crazy:Regrettably, moviefan claims the bet is off because NASA changed how they weighted temperature readings by buckets in ships.
What he refuses to admit is that we had this discussion during the bet and he twice confirmed he would continue the bet with the new NASA numbers.
...
Moviefan claims the bet shouldn't have continued because NASA changed some weighting of measurements, but the problem is he already agreed to continue the bet.
Moviefan should stand by his own words and admit he lost the bet.
So in order to win the bet, all the temperature has to do is hit 0.83ºC anomaly for the year of 2015, correct?
#1 - 0.86ºChttp://climate.nasa.gov/vital-signs/global-temperature/
If that's the chart you're saying will hit 0.83 at the end of 2015, we definitely have a bet.
#2 - 0.766ºCThe adjusted bet is 0.86 degrees Celsius. Take it or leave it.
You have until the end of Sunday to decide whether or not you are taking the adjusted bet.
https://terb.cc/vbulletin/showthrea...made-up-your-mind-on-climate-change-yet/page8That works out to an average for the year of 0.766ºC -- well below 0.83ºC. According to the exact terms that Frankfooter insisted must "stand," Frankfooter lost the bet.
#4 - 0.745ºC and 0.85ºC in the same bad postThe 0.74ºC anomaly for 2014 plus the originally agreed-upon year-over-year increase of 0.15ºC equals 0.89ºC.
If you want to propose a revised bet of 0.89ºC, you might get an agreement.
#5 - Trying to replace the chart specified in the bet with a different chart at a different web address.And 0.745ºC is nowhere near the IPCC "projection" of 0.85ºC for 2015 (which was derived from the same 1961-1990 baseline, as shown in the Hotwhopper graph).
#6 Deliberate use of quotes out of context.
https://terb.cc/vbulletin/showthrea...e-change-yet&p=5479780&viewfull=1#post5479780There is no dispute that we bet on a year-over-year increase of at least 0.15ºC.
0.43ºC."0.43ºC"?
:Eek:
The bet was based on the IPCC's predictions of temperature increases of 0.2ºC per decade, not numerical changes produced retroactively through changes in methodology.
You posted a graph that showed a 0.43ºC anomaly for 1995 and we agreed to bet on whether there would be a minimum increase of 0.4ºC over 20 years.
So we bet on the remaining distance from the original 1995 anomaly of 0.43ºC.
So in order to win the bet, all the temperature has to do is hit 0.83ºC anomaly for the year of 2015, correct?
http://climate.nasa.gov/vital-signs/global-temperature/
If that's the chart you're saying will hit 0.83 at the end of 2015, we definitely have a bet.
NASA reported:
- 2015 anomaly: 0.87ºC

We both agreed to use this chart:
http://climate.nasa.gov/vital-signs/global-temperature/
(W)e bet whether or not the IPCC projection of 0.2ºC was accurate, from 1995-2015, based on the reported 1995 global temperature anomaly of 0.43ºC.

:Eek:0.43ºC correct.
It takes a certain kind of person to post something that shows himself to be a lying fool.
Yes, at the time 1995's reported global temperature anomaly was 0.43ºC, according to NASA, that number was used to reach the number we agreed on for the bet, 0.83ºC."...the reported 1995 global temperature anomaly of 0.43ºC"?
:Eek:
The bet was based on the IPCC's predictions of temperature increases of 0.2ºC per decade, not numerical changes produced retroactively through changes in methodology.
You posted a graph that showed a 0.43ºC anomaly for 1995 and we agreed to bet on whether there would be a minimum increase of 0.4ºC over 20 years.
So we bet on the remaining distance from the original 1995 anomaly of 0.43ºC.
So in order to win the bet, all the temperature has to do is hit 0.83ºC anomaly for the year of 2015, correct?
http://climate.nasa.gov/vital-signs/global-temperature/
If that's the chart you're saying will hit 0.83 at the end of 2015, we definitely have a bet.
NASA reported:
- 2015 anomaly: 0.87ºC

Yes, at the time 1995's reported global temperature anomaly was 0.43ºC, according to NASA, that number was used to reach the number we agreed on for the bet, 0.83ºC.
(W)e had this discussion during the bet and he twice confirmed he would continue the bet with the new NASA numbers.
We both agreed to use this chart:
http://climate.nasa.gov/vital-signs/global-temperature/

:Eek:0.43ºC correct.
It takes a certain kind of person to post something that shows himself to be a lying fool.
(W)e had this discussion during the bet and he twice confirmed he would continue the bet with the new NASA numbers.
"rest of 2015"??New numbers = including the rest of 2015's data.


:biggrin1:(W)hat is moviefan talking about? He claims that the bet was made on a different chart....
It takes a certain kind of person to post something that shows himself to be a lying fool.
Yes, your second attempt at cheating you tried to argue that the we should only count the first few months of 2015 for the total, did you forget that one?"rest of 2015"??
:biggrin1:
https://terb.cc/vbulletin/showthrea...obal-warming&p=5429544&viewfull=1#post5429544- January: 0.75ºC (http://scienceblogs.com/gregladen/20...m-was-january/)
- February: 0.82ºC (Laden reported a lower number, but it was subsequently adjusted: http://scienceblogs.com/gregladen/20...warming-trend/)
- March: 0.84ºC (http://scienceblogs.com/gregladen/20...ry-warm-month/)
- April: 0.71ºC (http://scienceblogs.com/gregladen/20...-warm-was-may/)
- May: 0.71ºC (http://scienceblogs.com/gregladen/20...-warm-was-may/)
That works out to an average for the year of 0.766ºC -- well below 0.83ºC. According to the exact terms that Frankfooter insisted must "stand," Frankfooter lost the bet.
And that link still shows 0.87ºC.http://climate.nasa.gov/vital-signs/global-temperature/
If that's the chart you're saying will hit 0.83 at the end of 2015, we definitely have a bet.
(W)e bet whether or not the IPCC projection of 0.2ºC was accurate, from 1995-2015, based on the reported 1995 global temperature anomaly of 0.43ºC.
http://climate.nasa.gov/vital-signs/global-temperature/For the record, the only source I ever agreed to is the live NASA chart that we used for the bet.

:Eek:0.43ºC correct.
It takes a certain kind of person to post something that shows himself to be a lying fool.
Are you calling yourself a liar again?"...the reported 1995 global temperature anomaly of 0.43ºC"?
:Eek:
The bet was based on the IPCC's predictions of temperature increases of 0.2ºC per decade, not numerical changes produced retroactively through changes in methodology.
You posted a graph that showed a 0.43ºC anomaly for 1995 and we agreed to bet on whether there would be a minimum increase of 0.4ºC over 20 years.
So we bet on the remaining distance from the original 1995 anomaly of 0.43ºC.
So in order to win the bet, all the temperature has to do is hit 0.83ºC anomaly for the year of 2015, correct?
http://climate.nasa.gov/vital-signs/global-temperature/
If that's the chart you're saying will hit 0.83 at the end of 2015, we definitely have a bet.
NASA reported:
- 2015 anomaly: 0.87ºC


