
What did it tell you?1st,...I did NOT ask you,...2nd,...that is also a weasel response,...you taking lessons from frankie,...???
FAST


Is global climate policy actually about global income redistribution ?
- Thread starter Big Sleazy
- Start date
- Status
- Not open for further replies.
No it isn't, and posting graphs showing that other similar and larger changes WERE natural is a spurious argument. The CURRENT temperature change is clearly the result of human activity.current temperature changes is natural
What your graph actually did show was that the current human caused temperature change is still small compared to some of the naturally caused changes in the past.
Exactly.Policy focus on redistribution doesn't meant the underlying issue isn't valid.
There are people who are using this as an excuse to make money. Doesn't mean it isn't happening. But is does mean those with there hand out and those wanting money to "solve" it need to be scrutinized for legitimacy.
And politicians wanting money need to understand that putting it into the general coffers and creating taxes without a time limit for revue result in siphoning to other purposes.
When your buddy frankie replies,...What did it tell you?
But what is more important,...what is the bottom line of the link that frankie spammed AGAIN,...???
They showed a number of "possibilities" of what is causing climate gate,...then summarize,...what is their summery.
FAST
I know charts are really hard for you notsofast.So after all that weaseling,...just what does the deforestation graph tell you,...assuming you can actually read the graph,...which has been quite evident from your posts,...you can't,...or you'r just not man enough to state what the "influence" is.
I'm going with the latter.
FAST
So I'll help out.
That chart shows that deforestation and land use has been considered as a possible climate change forcing, much as you claim otherwise, and its influence is relatively minor. And note that not only are they calculating deforestation and the change of CO2 sinks but they are also considering the albedo, or reflective quality, of forests, roads and human work on land use, that sum total adds a slight cooling effect to the planet.
In other words, you are wrong both with your claim that they don't consider deforestation and that its effect is major.
As usual don't know what you are talking about.
Good to know
So don't get upset when you see someone driving 5000 Lb pickup trucks, or 500 HP sports cars, or flying to the Caribbean,...don't mean shit,...its relatively minor.
And if you see some 3rd world country clearing forests by fire,...don't mean shit,...it cools the earth.
The fact that trees convert CO2 to oxygen,...don't mean shit,...who needs oxygen.
FAST
So there you have it folks,...the total of the whole worlds transportation output of CO2,...which is equivalent to what deforestation contributes in CO2,...according to the three stooges, NOAA, NASA and IPCC,... is relatively minor.I know charts are really hard for you notsofast.
So I'll help out.
That chart shows that deforestation and land use has been considered as a possible climate change forcing, much as you claim otherwise, and its influence is relatively minor. And note that not only are they calculating deforestation and the change of CO2 sinks but they are also considering the albedo, or reflective quality, of forests, roads and human work on land use, that sum total adds a slight cooling effect to the planet.
In other words, you are wrong both with your claim that they don't consider deforestation and that its effect is major.
As usual don't know what you are talking about.
So don't get upset when you see someone driving 5000 Lb pickup trucks, or 500 HP sports cars, or flying to the Caribbean,...don't mean shit,...its relatively minor.
And if you see some 3rd world country clearing forests by fire,...don't mean shit,...it cools the earth.
The fact that trees convert CO2 to oxygen,...don't mean shit,...who needs oxygen.
FAST
He discredits any cause he associates with. People here think there are no moderate or honest Palestinian activists because of him, and he certainly isn't helping the cause of right and good by spamming here.When your buddy frankie replies,...
But what is more important,...what is the bottom line of the link that frankie spammed AGAIN,...???
They showed a number of "possibilities" of what is causing climate gate,...then summarize,...what is their summery.
FAST
Nonetheless, that graph did show that cutting down trees has not been the primary cause of global warming.
You're making moviefan look smart.So there you have it folks,...the total of the whole worlds transportation output of CO2,...which is equivalent to what deforestation contributes in CO2,...according to the three stooges, NOAA, NASA and IPCC,... is relatively minor.
FAST
1) Why are you now talking about transportation CO2?
2) Where are the numbers backing up your claims?
Will you apologize and admit you don't know what you are talking about when you are proven wrong?
How would you -- the guy who never completed Grade 3 -- know what smart looks like?You're making moviefan look smart.
In any event, let's see if you can answer the three questions I posed earlier:
1) Why does the line plotting the predicted temperature increases that were supposed to be created by man-made emissions stop at 2004?
2) Why is there no acknowledgement that the "simulations" have a terrible track record? (The model runs were 97% wrong, according to the IPCC's most recent report.)
3) Why didn't Bloomberg/NASA make more of an effort to explain to readers that "simulations" can be entirely different from reality?
Last edited:
It doesn't, it stops at 2005, as do all the forcings. And of course the explanation why is included on the page, but you were too stupid to look for it.How would you -- the guy who never completed Grade 3 -- know what smart looks like?
In any event, let's see if you can answer the three questions I posed earlier:
1) Why does the line plotting the predicted temperature increases that were supposed to be created by man-made emissions stop at 2004?
http://www.bloomberg.com/graphics/2015-whats-warming-the-world/A Global Research Project
GISS produced the results shown here in 2012, as part of its contribution to an international climate-science research initiative called the Coupled Model Intercomparison Project Phase Five. Let's just call it "Phase-5."
Phase-5 is designed both to see how well models replicate known climate history and to make projections about where the world’s temperature is headed. Initial results from Phase-5 were used in the 2013 scientific tome published by the Intergovernmental Panel on Climate Change.
There are more than 30 different kinds of experiments included in Phase-5 research. These tests address questions like, what would happen to the Earth’s temperature if atmospheric carbon dioxide suddenly quadrupled? Or, what would the world’s climate be like through 2300 if we keep burning fossil fuels at the current rate?
Phase-5 calls for a suite of "historical" experiments. Research groups were asked to see how well they could reproduce what's known about the climate from 1850-2005. They were also asked to estimate how the various climate factors—or "forcings"—contribute to those temperatures. That's why this graphic stops in 2005, even though the GISS observed temperature data is up-to-date. The years 2005-2012 were not a part of the Phase-5 "historical" experiment.
Because they don't have a terrible track record, you are just too stupid to accept that.2) Why is there no acknowledgement that the "simulations" have a terrible track record? (The model runs were 97% wrong, according to the IPCC's most recent report.)
As you know with the bet you lost, which was made on IPCC projections.
And yes, every time you claim the IPCC projections are inaccurate will result in another reminder that you lost the bet because the IPCC is accurate and you are stupid.
If they dumbed it down to yours and FAST's level of ignorance it would be 20 pages of basics before they got to the chart.3) Why didn't Bloomberg/NASA make more of an effort to explain to readers that "simulations" can be entirely different from reality?
As it is, even the pictures and charts are too hard for you and FAST to follow.
I see,...in frankies world,... CO2 from transportation,... is some how different from CO2 created by gas power plants,manufacturing, home heating etc....wow,... we learn something new from frankie everyday.You're making moviefan look smart.
1) Why are you now talking about transportation CO2?
2) Where are the numbers backing up your claims?
Will you apologize and admit you don't know what you are talking about when you are proven wrong?
So are you now stating that the TOTAL addition of co2 to the atmosphere due deforestation,...is NOT equal to that of transportation,...???
According to frankies web site of wisdom,...burning forests,... REDUCES the earths temperature.
FAST
You are the one that made the claim about CO2 from transportation, yet you can't defend it or supply real numbers.I see,...in frankies world,... CO2 from transportation,... is some how different from CO2 created by gas power plants,manufacturing, home heating etc....wow,... we learn something new from frankie everyday.
Its just more nonsense from you, it appears.
No, that is your claim from post #28.So are you now stating that the TOTAL addition of co2 to the atmosphere due deforestation,...is NOT equal to that of transportation,...???
All I asked was that you back it up with proof.
But that is too much for you, isn't it?
Nope, that's a typically stupid mistake from you.According to frankies web site of wisdom,...burning forests,... REDUCES the earths temperature.
FAST
The chart doesn't talk about 'burning forests', it talks about land use.
People don't 'burn forests' when they use land generally.
You've just reaffirmed -- once again -- that you never completed Grade 3.As you know with the bet you lost, which was made on IPCC projections.
And yes, every time you claim the IPCC projections are inaccurate will result in another reminder that you lost the bet because the IPCC is accurate and you are stupid.
After more than three months of trying, you're still struggling to correctly add 0.74 + 0.15. Unbelievable.
(Y)ou fixated on the difference between 2014's temperature and the bet, which needed a record year over year increase for me to win.
It was a year-over-year increase of 0.15ºC of the 2014 anomaly from the time of the bet.
NASA said:Globally-averaged temperatures in 2015 shattered the previous mark set in 2014 by 0.23 degrees Fahrenheit (0.13 Celsius).
https://www.nasa.gov/press-release/...-shattering-global-warm-temperatures-in-2015/
http://climate.nasa.gov/vital-signs/global-temperature/
The Six attempts at 'Moving the Goal Posts'
That's not NASA.
...now you're faking charts.
Yet another lie from you, claiming that's chart we bet on.
Are you expecting me to try to figure out your faulty weasel math?
Screw you, I'm not going down that rabbit hole.
It takes a certain kind of person to post something that shows himself to be a lying fool.
Now you're down to copying and pasting random ... quotes as if they had some kind of point to them.

:thumb:
I'm done.
You've just reaffirmed -- once again -- that you never completed Grade 3.
After more than three months of trying, you're still struggling to correctly add 0.74 + 0.15. Unbelievable.
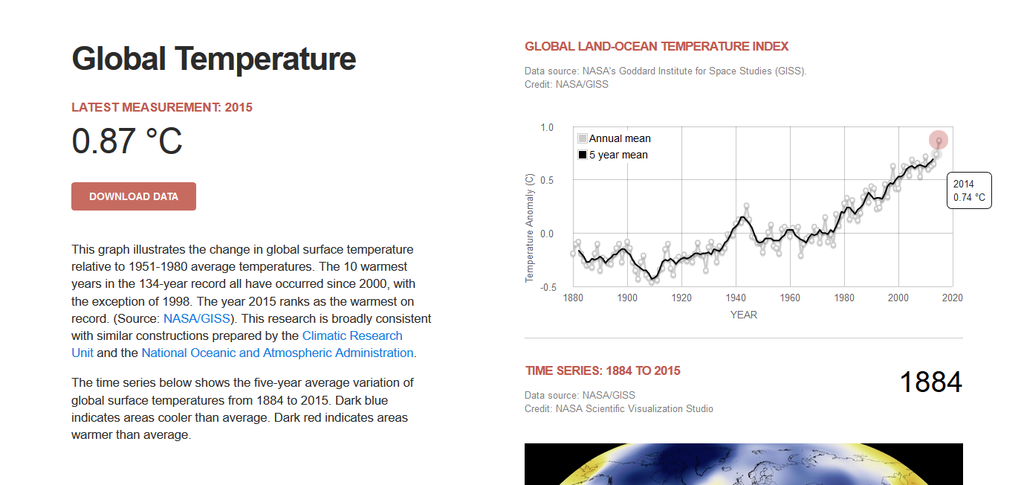
After three months you still won't admit that 0.87ºC is higher then the 0.83ºC we bet on and that you lost the bet?
Need I point out that your reply is a typical Dunning-Kruger type response, referring to two numbers that weren't even part of the bet combined with a straw man claim about basic addition?
It really just confirms how ignorant you are and how you refuse to see it.
In May, 2014, we bet whether or not the IPCC projection of 0.2ºC was accurate, from 1995-2015, based on the reported 1995 global temperature anomaly of 0.43ºC.
We bet whether 2015 would hit 0.83ºC.
2015's global temperature anomaly came out as 0.87ºC.
You lost.
http://climate.nasa.gov/vital-signs/global-temperature/
If that's the chart you're saying will hit 0.83 at the end of 2015, we definitely have a bet.
In May, 201(5), we bet whether or not the IPCC projection of 0.2ºC was accurate, from 1995-2015...
(Y)ou fixated on the difference between 2014's temperature and the bet, which needed a record year over year increase for me to win.
It was a year-over-year increase of 0.15ºC of the 2014 anomaly from the time of the bet.
NASA said:Globally-averaged temperatures in 2015 shattered the previous mark set in 2014 by 0.23 degrees Fahrenheit (0.13 Celsius).
https://www.nasa.gov/press-release/...-shattering-global-warm-temperatures-in-2015/
http://climate.nasa.gov/vital-signs/global-temperature/
The Six attempts at 'Moving the Goal Posts'
That's not NASA.
...now you're faking charts.
Yet another lie from you, claiming that's chart we bet on.
Are you expecting me to try to figure out your faulty weasel math?
Screw you, I'm not going down that rabbit hole.
It takes a certain kind of person to post something that shows himself to be a lying fool.
Now you're down to copying and pasting random ... quotes as if they had some kind of point to them.
:thumb:
I'm done.
Aw, poor loser.
Still trying to claim that 0.87 isn't higher then 0.83?
Once a denier, always a denier.....
Still trying to claim that 0.87 isn't higher then 0.83?
Once a denier, always a denier.....
In May, 201(5), we bet whether or not the IPCC projection of 0.2ºC was accurate, from 1995-2015...
(Y)ou fixated on the difference between 2014's temperature and the bet, which needed a record year over year increase for me to win.
It was a year-over-year increase of 0.15ºC of the 2014 anomaly from the time of the bet.
NASA said:Globally-averaged temperatures in 2015 shattered the previous mark set in 2014 by 0.23 degrees Fahrenheit (0.13 Celsius).
https://www.nasa.gov/press-release/...-shattering-global-warm-temperatures-in-2015/
http://climate.nasa.gov/vital-signs/global-temperature/
The Six attempts at 'Moving the Goal Posts'
That's not NASA.
...now you're faking charts.
Yet another lie from you, claiming that's chart we bet on.
Are you expecting me to try to figure out your faulty weasel math?
Screw you, I'm not going down that rabbit hole.
It takes a certain kind of person to post something that shows himself to be a lying fool.
Now you're down to copying and pasting random ... quotes as if they had some kind of point to them.
:thumb:
Once a denier, always a denier.....
- Status
- Not open for further replies.

