
I you seem to think greedy politicians understand science.You and larue both seem to think you understand the science.
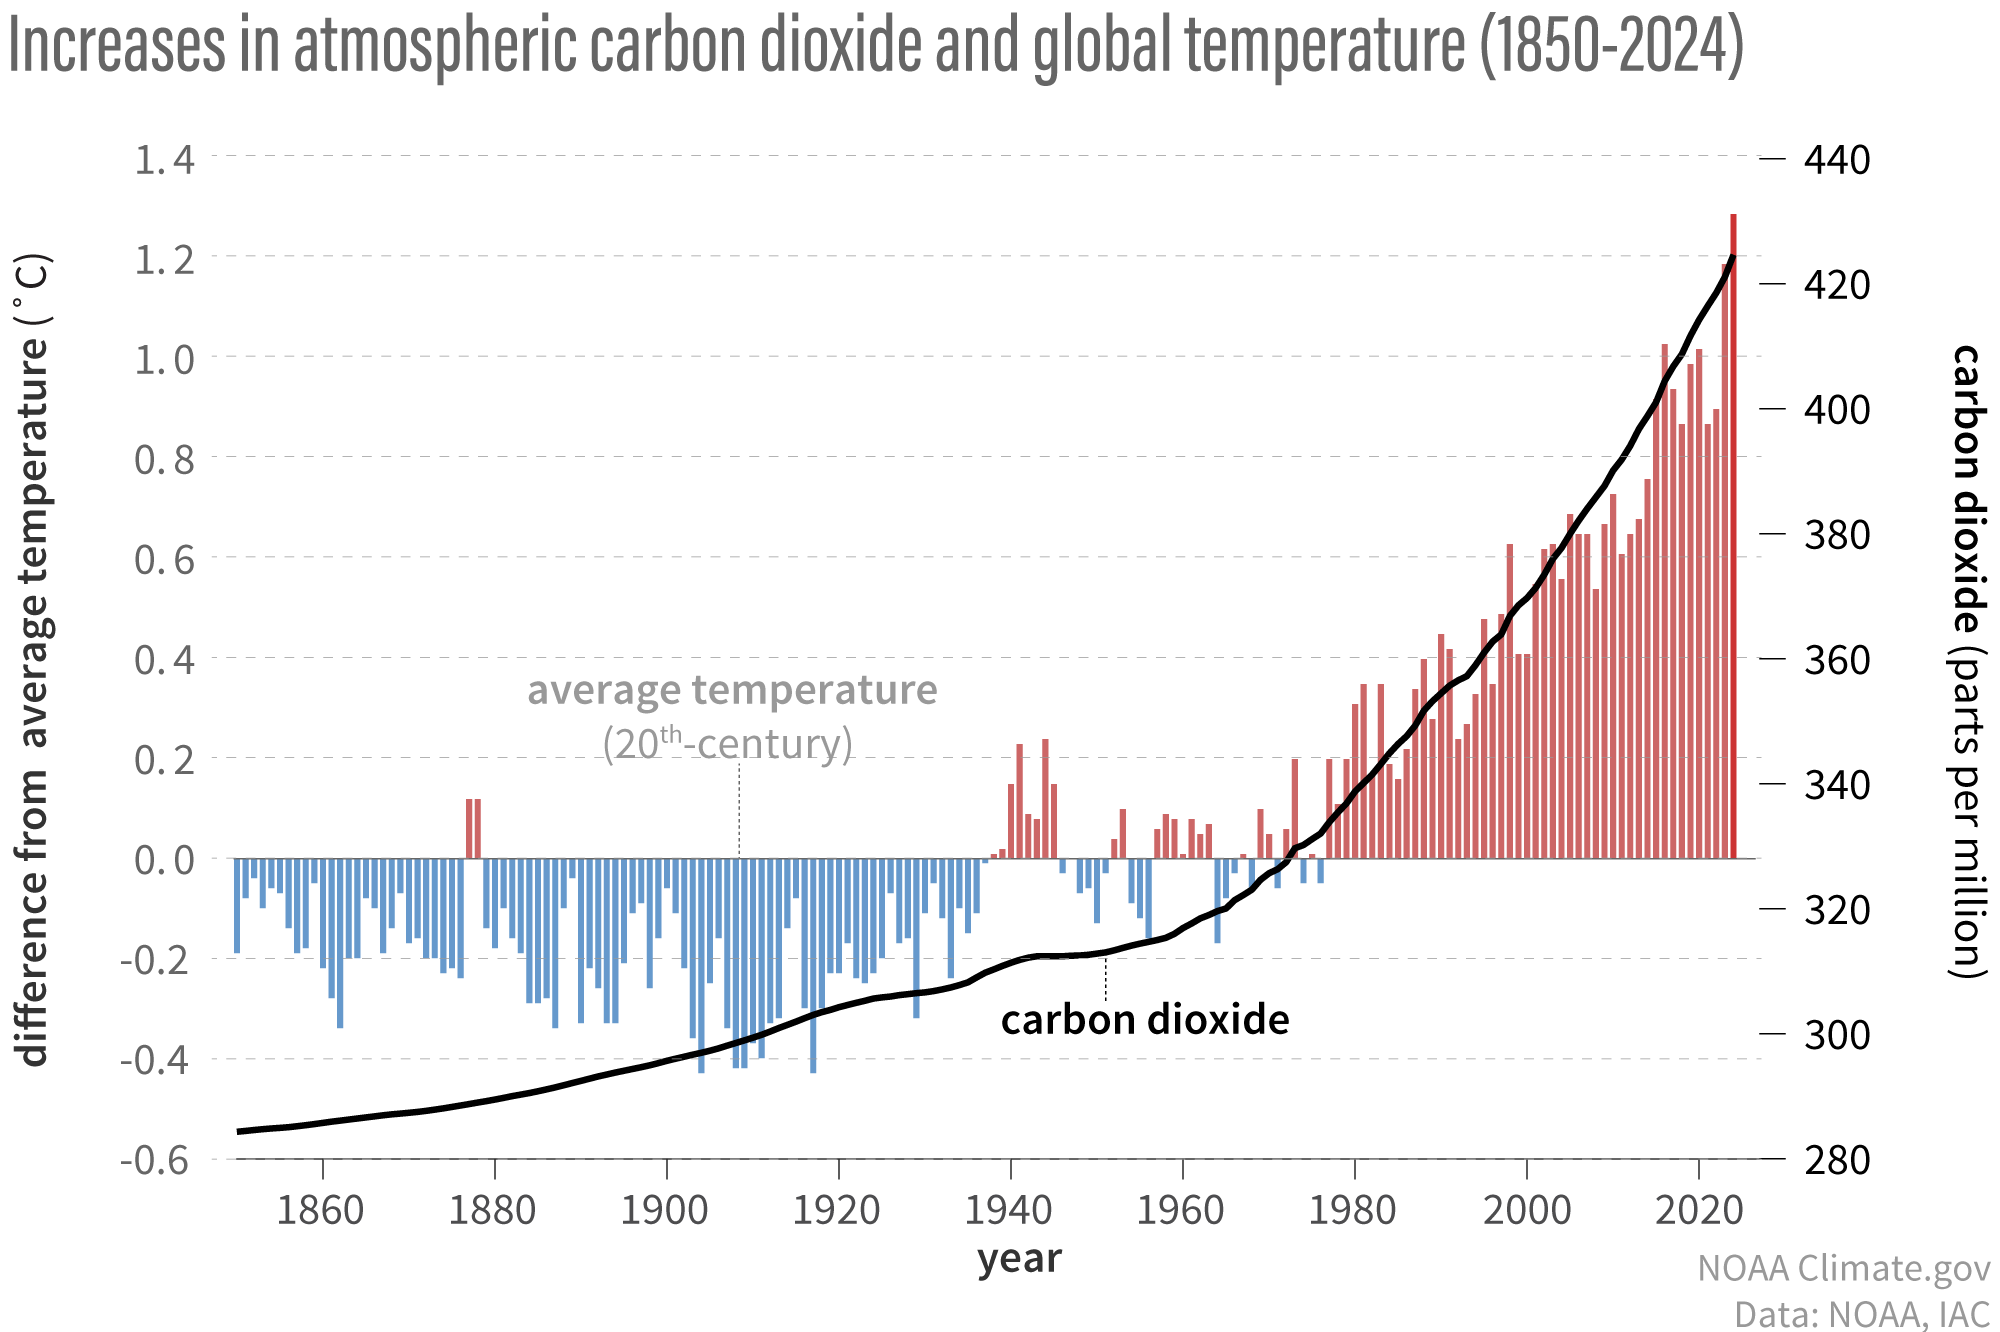
What does these charts mean to you?


PM Carney considers Canada a 'leader in climate change’
- Thread starter oil&gas
- Start date
That is interestingAI Overview
The Antarctic Ice Sheet contains approximately 24,380,000 gigatonnes (billions of metric tons) of ice. It covers nearly 14 million square kilometers, holds roughly 90% of the world's ice
However
what fraction is 100 billion / 24,380,000 gigatonnes ?
An exceptionally small fraction
How many zeros after the decimal pace?
the recent gain and losses are just natural variations / mother nature
interestingly though the climate alarmist narrative did not predict / permit additions of that magnitude

You and larue both seem to think you understand the science.
What does these charts mean to you?
they illustrate that Leon Simons does not understand:
1. RCP8.5 is a scenario
2. RCP8.5 was deemed to be ridiculously improbable/ impossible , despite its use as the basis for the alarmist propaganda
yet Leon Simons falsely claims observations are much worst than even the ridiculously improbable/ impossible RCP8.5 scenario
Leon Simons is the Executive Director of the Club of Rome Netherlands
Leon has been a knotty boy
and Frankfurter just continues to cut and paste internet propaganda without thinking about what he is posting
Last edited:
Thanks for confirming you can't understand the issues and science yourself.I you seem to think greedy politicians understand science.
RCP8.5 was the worst case scenario if governments didn't implement enough change.they illustrate that Leon Simons does not understand:
1. RCP8.5 is a scenario
2. RCP8.5 was deemed to be ridiculously improbable/ impossible , despite its use as the basis for the alarmist propaganda
yet Leon Simons falsely claims observations are much worst than even the ridiculously improbable/ impossible RCP8.5 scenario
Leon Simons is the Executive Director of the Club of Rome Netherlands
Leon has been a knotty boy
and Frankfurter just continues to cut and paste internet propaganda without thinking about what he is posting
You know by the CO2 chart you keep posting that levels are still going up, that it is in fact the worst case scenario.
Its not only plausible, but we are experiencing living through RCP8.5.
This is 2 years old but things are only getting worse.
We are already seeing feedback effects that increase the effects of climate change.
Last edited:
and deemed impossible / implausible, despite being the basis for all the scary climate propagandaRCP8.5 was the worst case scenario if governments didn't implement enough change.
noYou know by the CO2 chart you keep posting that levels are still going up, that it is in fact the worst case scenario
it just shows that any attempts to shut down fossil fuels will have no observable impact on the accumulation of atmospheric co2
the experiment was run in 2020, when 1/2 of the worlds population was locked down
and there was no observable change in the relentless upward trend

will you look at that ?? 1/2 the world population is locked down and no observable impact on the curves trajectory.
the incremental co2 must becoming from the oceans
and therefore no amount of EVs, renewables, Swedish teenage stooges or frankfooter disinformation is going to alter that curves trajectory
the good news is CO2 is not the control knob for our complex, non-linear, chaotic and dynamic climate system
we are living in RCP8.5 right now, you say ?Its not only plausible, but we are experiencing living through RCP8.5.
Oh boy, the same scenario which predicted the developing world would experience rapid economic growth while simultaneously become uninhabitable wastelands
give it a rest frankfooter
your propaganda is internally inconsistent , improbable and impossible in addition to ridiculous
This is 2 years old but things are only getting worse.
We are already seeing feedback effects that increase the effects of climate change.
all you are seeing is your climate con falling apart
your climate con is dead frankfooter
That is a chart that shows RCP8.5 levels of CO2.
Compare your chart to the chart in the bottom left corner below
RCP 8.5

Last edited:
That is a chart that shows RCP8.5 levels of CO2.
Compare your chart to the chart in the bottom left corner below
RCP 8.5
too bloody funny
you did not bother to look / understand what the y-axis represented on the graphs you posted
each of your propaganda '''charts '' is a temperature change vs time graph
the NOAA '''chart ' is a CO2 concentration in parts per million vs. time graph
they do not represent the same physical property
you can not compared them
that is a failure in grade 8 science class
it is just failure after another failure for you frankfooter
too bloody funny
now get this straight
RCP8.5 is an improbable/ impossible scenario with conflicting internal predictions and RCP8.5 is a never going to happen fantasy scenario
just as is all the scary climate propaganda based on RCP8.5
i noticed you just ignore the fact the 2020 lock downs has no observable change on the curves trend
1/2 the world population is locked down and no observable impact on the curves trajectory.
the incremental co2 must becoming from the oceans
and therefore no amount of EVs, renewables, Swedish teenage stooges or frankfooter disinformation is going to alter that curves trajectory
the good news is CO2 is not the control knob for our complex, non-linear, chaotic and dynamic climate system
your climate con is dead frankfooter
dead like disco
Last edited:
larue, I'll have to add 2+2 for you.too bloody funny
you did not bother to look / understand what the y-axis represented on the graphs you posted
each of your propaganda '''charts '' is a temperature change vs time graph
the NOAA '''chart ' is a CO2 concentration in parts per million vs. time graph
they do not represent the same physical property
you can not compared them
that is a failure in grade 8 science class
it is just failure after another for you frankfooter
too bloody funny
now get this straight
RCP8.5 is an improbable/ impossible scenario with conflicting internal predictions and RCP8.5 is a never going to happen fantasy scenario
just as is all the scary climate propaganda based on RCP8.5
i noticed you just ignore the fact the 2020 lock downs has no observable change on the curves trend
1/2 the world population is locked down and no observable impact on the curves trajectory.
the incremental co2 must becoming from the oceans
and therefore no amount of EVs, renewables, Swedish teenage stooges or frankfooter disinformation is going to alter that curves trajectory
the good news is CO2 is not the control knob for our complex, non-linear, chaotic and dynamic climate system
your climate con is dead frankfooter
dead like disco
You posted the chart with present CO2 levels, which are not declining and following the worst case scenario known as RCP8.5.
I added a chart that shows we are on track with temperature for RCP 8.5.
Here they are on the same chart.
This is the planet on the RCP 8.5, worst case scenario, trajectory.
That will take us to 4-6ºC by the end of the century and killing billions.
a task , which apparently is well beyond your capabilitieslarue, I'll have to add 2+2 for you.
noYou posted the chart with present CO2 levels, which are not declining and following the worst case scenario known as RCP8.5.
I added a chart that shows we are on track with temperature for RCP 8.5.
you were quite clear that you wanted to compare the a temperature change chart to a co2 concentration chart
you do not understand the difference between correlation and causationThat is a chart that shows RCP8.5 levels of CO2.
Compare your chart to the chart in the bottom left corner below

as usual you do not have a clue what you are talking aboutHere they are on the same chart.
This is the planet on the RCP 8.5, worst case scenario, trajectory.
That will take us to 4-6ºC by the end of the century and killing billions.
AI Overview
RCP8.5, once considered a "business-as-usual" scenario, is now widely viewed by scientists as a low-likelihood or extreme "worst-case" scenario, rather than a probable future. It assumes a massive, unrealistic expansion of global coal usage—increasing by over 500% by 2100—that contradicts current trends in renewable energy adoption.
-
Low Probability:The scenario is considered exceedingly unlikely, as global emissions trends are currently tracking much lower, closer to RCP4.5 or RCP6.0.
-
Outdated Assumptions:RCP8.5 was developed assuming high economic growth, no climate policies, and a resurgence in coal use, which has not materialized.
-
Not "Business as Usual":It is better described as an extreme, high-risk, or "worst-case" scenario (e.g., in the case of complete policy failure) rather than a realistic, central projection.
now get this straight
RCP8.5 is an improbable/ impossible scenario with conflicting internal predictions and RCP8.5 is a never going to happen fantasy scenario
just as is all the scary climate propaganda based on RCP8.5
i noticed
1/2 the world population is locked down and no observable impact on the curves trajectory.
the incremental co2 must be coming from the oceans
and therefore no amount of EVs, renewables, Swedish teenage stooges or frankfooter disinformation is going to alter that curves trajectory
the good news is CO2 is not the control knob for our complex, non-linear, chaotic and dynamic climate system

Attachments
-
 561 bytes Views: 0
You are relentlessly idiotic, larue.a task , which apparently is well beyond your capabilities
no
you were quite clear that you wanted to compare the a temperature change chart to a co2 concentration chart
you do not understand the difference between correlation and causation
The IPCC projections said increasing CO2 and greenhouse gases would raise temperatures.
That is exactly what is happening and now with the worst case scenario, RCP 8.5.
Your theory is that maybe the oceans decided to spontaneously release a shit ton of CO2 for no particular reason.
Which still means you are admitting that CO2 levels change the temperature of the planet.
I know, you're going back to your 10 year old chart of the temperature in the clouds, in the tropics only, from faulty data to try to prove your point because you know every other chart measuring the climate makes you look like an idiot.
If you really think its correlation then you need two separate theories, with real evidence, to back why you think CO2 levels are rising, why the temperature is also rising and why those two things aren't related, as every scientist on the planet believes.
you intentionally try to deceive othersYou are relentlessly idiotic, larue.
RCP 8.5. is improbable, impossible and internally illogicalThe IPCC projections said increasing CO2 and greenhouse gases would raise temperatures.
That is exactly what is happening and now with the worst case scenario, RCP 8.5.
not going to happen
Your propaganda is despicable and evil as it is built on a lie
its not a theoryYour theory is that maybe the oceans decided to spontaneously release a shit ton of CO2 for no particular reason.
an inverse temperature relationship with the solubility of CO2 in water is well known
???? WTF ???????Which still means you are admitting that CO2 levels change the temperature of the planet.
not at all
What part of this do you not understand
it is comical that you believe co2 measured in parts per million is the control knob of our complex, non-linear, chaotic and dynamic climate systemthe good news is CO2 is not the control knob for our complex, non-linear, chaotic and dynamic climate system
i look nothing like youI know, you're going back to your 10 year old chart of the temperature in the clouds, in the tropics only, from faulty data to try to prove your point because you know every other chart measuring the climate makes you look like an idiot.
your scientific understanding is well below high school level , that is brutally obvious
you post charts without understanding what they represent
and you look like a damn fool doing so
what is wrong with you ?If you really think its correlation then you need two separate theories, with real evidence, to back why you think CO2 levels are rising, why the temperature is also rising and why those two things aren't related, as every scientist on the planet believes.
science does not require a substitute to dismiss what is wrong
i do not need any theory to prove your climate alarmism wrong
your climate alarmism does not agree with experiment. therefor it is wrong. period. and that is how science works

see the climate alarmism theory is the red line
the observations from multiple INDEPENDANT experimental data sets are the circles, squares and circles
the climate alarmism theory does not agree with experiment
therefore climate alarmism theory is wrong

i noticed you just ignore the fact the 2020 lock downs has no observable change on the curves trend
that was the definitive experiment
1/2 the world population is locked down and no observable impact on the curves trajectory.
and therefore no amount of EVs, renewables, Swedish teenage stooges or frankfooter disinformation is going to alter that curves trajectory
the incremental co2 must be coming from the oceans
the good news is CO2 is not the control knob for our complex, non-linear, chaotic and dynamic climate system

your climate con is dead frankfooter.
Last edited:
I don't care about your feelies that you are so sure RCP 8.5 can't happen.you intentionally try to deceive others
RCP 8.5. is improbable, impossible and internally illogical
not going to happen
The evidence shows it is happening.
You posted the CO2 levels that are still increasing and I posted the temps that show the warming is happening as they projected.
You have nothing other than your feelings here.
you do not care abouts factsI don't care about your feelies that you are so sure RCP 8.5 can't happen.
thats no big surprise
RCP 8.5. is improbable, impossible and internally illogicalThe evidence shows it is happening.
not going to happen
we know who posted whatYou posted the CO2 levels that are still increasing and I posted the temps that show the warming is happening as they projected.
the issue is you fail to understand the implications of the 2020 lock down experiment
you just ignore the fact the 2020 lock downs has no observable change on the curves trend
that was the definitive experiment
1/2 the world population is locked down and no observable impact on the curves trajectory.
and therefore no amount of EVs, renewables, Swedish teenage stooges or frankfooter disinformation is going to alter that curves trajectory <<<<<< Read this carefully
the incremental co2 must be coming from the oceans
the good news is CO2 is not the control knob for our complex, non-linear, chaotic and dynamic climate system <<<<<< then Read this carefully..... then wake up

btw, the models are flawed

your climate con is dead frankfooter
I don't care about your unfounded beliefs that RCP 8.5 can't happen any more than I care that you think NASA is propaganda and only you understand the true science.you do not care abouts facts
thats no big surprise
RCP 8.5. is improbable, impossible and internally illogical
not going to happen
You're worse than a flat earther.
Its not only CO2, sea level rises also show we are on RCP 8.5.
While all you have is your precious feelings that you are right.

I don't care about your unfounded beliefs that RCP 8.5 can't happen any more than I care that you think NASA is propaganda and only you understand the true science.
You're worse than a flat earther.
you do not care abouts facts
thats no big surprise
noIts not only CO2, sea level rises also show we are on RCP 8.5.
While all you have is your precious feelings that you are right.
your so called climate scientists have deemed RCP 8.5 as a never going to happen scenario
RCP8.5 is the basis for all of your climate alarmist propaganda and it is all based on a lie.AI Overview
Yes, the Representative Concentration Pathway 8.5 (RCP8.5) is widely deemed by scientists and climate researchers to be an increasingly implausible or highly improbable "business-as-usual" scenario for the 21st century.
you had better start your standard cancel culture routine on the climate scientists now.
they must be on Exxon's payroll
and you have no idea how corrupt and foolish you appear
BTW the models are flawed

and you still have not figured out the implications of the 2020 lock down experiment
i have given you lots of clues , yet you remain clueless
1/2 the world population is locked down and no observable impact on the curves trajectory.
and therefore no amount of EVs, renewables, Swedish teenage stooges or frankfooter disinformation is going to alter that curves trajectory <<<<<< Read this carefully
the incremental co2 must be coming from the oceans
the good news is CO2 is not the control knob for our complex, non-linear, chaotic and dynamic climate system <<<<<< then Read this carefully..... then wake up

The only 'fact' in your post is the chart that shows CO2 emissions are on the path for RCP 8.5.you do not care abouts facts
thats no big surprise
The rest of your post is just your feelings and religious faith that the oil disinformation you've been posting is the 'real truth'.
You can't even tell when the crap you post totally contracts your statements.
For instance, none of the crap you post says the greenhouse effect isn't real, yet you continue to claim 'CO2 is not the control knob' or something like that.
Its really quiet sad how you hold views that are even more extreme than the oil$gas industry propaganda.
no it proves that no amount of EVs, renewables, Swedish teenage stooges or frankfooter disinformation is going to alter that curves trajectory <<<<<< Read this carefullyThe only 'fact' in your post is the chart that shows CO2 emissions are on the path for RCP 8.5.
the incremental co2 must be coming from the oceans
the good news is CO2 is not the control knob for our complex, non-linear, chaotic and dynamic climate system <<<<<< then Read this carefully..... then wake up
you still have not figured out that the 2020 lock down experiment results completely nullifies your propaganda efforts
the c02 trend is not anthropogenic
if the locking down 1/2 the worlds population did not alter the trend, there is nothing we can do that will alter the trend, let alone stop it
the good news is CO2 is not the control knob for our complex, non-linear, chaotic and dynamic climate system <<<<<< then Read this carefully..... then wake up
there is no pathway to an impossible anthropogenic RCP8.5 scenario created for propaganda purposesare on the path for RCP 8.5
the physical laws of nature do not conform to propaganda
Are scientists and climate researchers on Exxons payroll ?AI Overview
Yes, the Representative Concentration Pathway 8.5 (RCP8.5) is widely deemed by scientists and climate researchers to be an increasingly implausible or highly improbable "business-as-usual" scenario for the 21st century.
well that's the thing about scientific facts such as absorption saturation, photosynthesis, the complexity of our climate system, the inability of climate science to model cloud formation, turbulence, the urban island heat effect, etc, etcThe rest of your post is just your feelings and religious faith that the oil disinformation you've been posting is the 'real truth'.
they do state the unvarnished 'real truth'.
no i am quite careful to think about consistencyYou can't even tell when the crap you post totally contracts your statements.
that is a foundational requirement of scientific understanding
you on the other hand rapid fire any post you can find on the internet without spending a few minutes to try and understand what the post actually means
that is pure scientific illiteracy and a very clear declaration that your objective is to intentionally mislead others and that you do not give a rats ass about the 'real truth' or scientific integrity
i have never claimed the greenhouse effect isn't realFor instance, none of the crap you post says the greenhouse effect isn't real, yet you continue to claim 'CO2 is not the control knob' or something like that.
and
CO2 is not the control knob for our complex, non-linear, chaotic and dynamic climate system
it is not my fault your scientific illiteracy prevents you from reconciling those two very compatible facts
your depth of thinking is unbelievably shallow
its not my fault you dropped out of high school.
Its really quiet comical and then sad, watching you a scientific illiterate try and fake his way through a scientific debate.Its really quiet sad how you hold views that are even more extreme than the oil$gas industry propaganda.
it is like watching a turtle that has been flipped on his back, .... funny and entertaining, but then it just becomes cruel
i can have some empathy for the turtle as he does not intentionally try to mislead others
BTW the climate models are deeply flawed as are all the evil climate alarmism propaganda based on them

Last edited:
Two incredibly idiotic claims.the incremental co2 must be coming from the oceans
the good news is CO2 is not the control knob for our complex, non-linear, chaotic and dynamic climate system <<<<<< then Read this carefully..... then wake up
1) Nobody on the planet believes that the increase in CO2 levels that you keep posting is coming from the oceans. You just made that up.
2) Not even the worst of the paid oil$gas disinformation people you quote here believe that the Greenhouse Effect is not real.
Those two beliefs are flat earther level idiotic.
not at allTwo incredibly idiotic claims.
Fact: the oceans exchange massive quantities of co2 with the atmosphere, way more than humans produce
Fact : Co2 solubility in water is inversely proportional to temperature
Fact: our climate system is complex, non-linear, chaotic and dynamic and is simply not driven by a trace inert gas
I have facts and scientific understanding
You have rhetoric and propaganda and an evil willingness to deliberately misinform others
Scientific truth is not defined by who / what you claim others believe1) Nobody on the planet believes that the increase in CO2 levels that you keep posting is coming from the oceans. You just made that up.
again, not my fault you dropped out of high school
Fact: the 2020 lockdowns of 1/2 the world population did not alter the accumulation trend of CO2 in the atmosphere
Fact: no amount of EVs, renewables, Swedish teenage stooges or frankfooter disinformation is going to alter that curves trajectory <<<<<< Read this carefully
what is wrong with you ?2) Not even the worst of the paid oil$gas disinformation people you quote here believe that the Greenhouse Effect is not real.
you were just told
and then you just repeat the same nonsense , incorrect stating what I believe ??????????i have never claimed the greenhouse effect isn't real
and
CO2 is not the control knob for our complex, non-linear, chaotic and dynamic climate system
once again, what is wrong with you ?
pathological
you pretending you understand climate and the exceptionally complex physics of climate is idioticThose two beliefs are flat earther level idiotic.
your climate con is dead Frankfooter
BTW: the climate models are deeply flawed

Last edited:

