Who cares what your feelings are about surface temperature. You also can't understand the kids level Greenhouse Effect.
they are not feelings they are facts
the physics involved is far more complicated and falsifies the children's propaganda you follow/ get mislead by
Your views are incredibly scientifically illiterate and you insult all of science here daily.
look in the mirror when you say that
you have continually and constantly demonstrated that you have zero scientific education and zero scientific understanding
it would be a comedy show watching you pretend to be scientifically literate if it were not for your very disturbing compulsion to deliberately mislead others
you do not have one ounce of respect for science and zero understanding of scientific integrity
climate alarmism mascaraing as science is going to erode public trust in science
you will not care one tiny bit and will be oblivious to the damage the climate con has caused
[Yet you refuse to accept all experimental observations made in the last decade.
hmm. from climate alarmists and activists who do not respect science and deliberately mislead others .
layer on the well know issues with the surface temperature data record
filled with errors
biased by the urban island heat effect
incomplete
has been fiddle with
then layer on the dishonest, evil and mentally unbalanced behavior of climate alarmists
the bullshit hockey stick
the' 'hide the decline' tampering of data,
the reprehensible , evil, cancelling of skeptical scientists
and then layer on the insane position of the original lunatic who was instrumental in establishing the international structures (like UNEP) that led to the creation of the Intergovernmental Panel on Climate Change.

AI Overview
Maurice Strong
(1929–2015) was a Canadian diplomat and entrepreneur who pioneered global environmental governance, acting as the first Executive Director of the
UN Environment Programme (UNEP) and organizing the 1972 Stockholm Conference and 1992 Rio Earth Summit. While not the founder of the IPCC, he was instrumental in establishing the international structures (like UNEP) that led to the creation of the Intergovernmental Panel on Climate Change.
yeah I reject your propaganda
if you has any sense you would see the tide has turned as more and more people are questioning the not only the ridiculous impossible climate solutions i.e. NetZero , carbon taxes, EV mandates etc, etc, etc, they are also questioning the propaganda

Did you really think you could fool a planetary population in perpetuity?
You refuse to accept temperature, precipitation, extreme weather events, jet stream changes, sea surface temperature changes and any other measurements.
no i don't, physical measurements are what there are
however if the measurement data sets are incomplete, filled with errors, tainted by the urban island heat effect or fiddled with then absolutely they need to be reject
re; extreme weather events
the IPCC has explicitly stated the vast majority of extreme weather events show no indication of any trend beyond natural variability
including:
- River floods
- Heavy precipitation and pluvial floods
- Landslides
- Drought (all types)
- Severe wind storms
- Tropical cyclones
- Sand and dust storms
- Heavy snowfall and ice storms
- Hail
- Snow avalanche
- Coastal flooding
- Marine heat waves
you know this as it has been shown to you many time
yet you you just wait a few days and then restate false claims about extreme weather
that you know to be wrong
you do this over and over and over again
you do this on a daily basis
you destroy your credibility
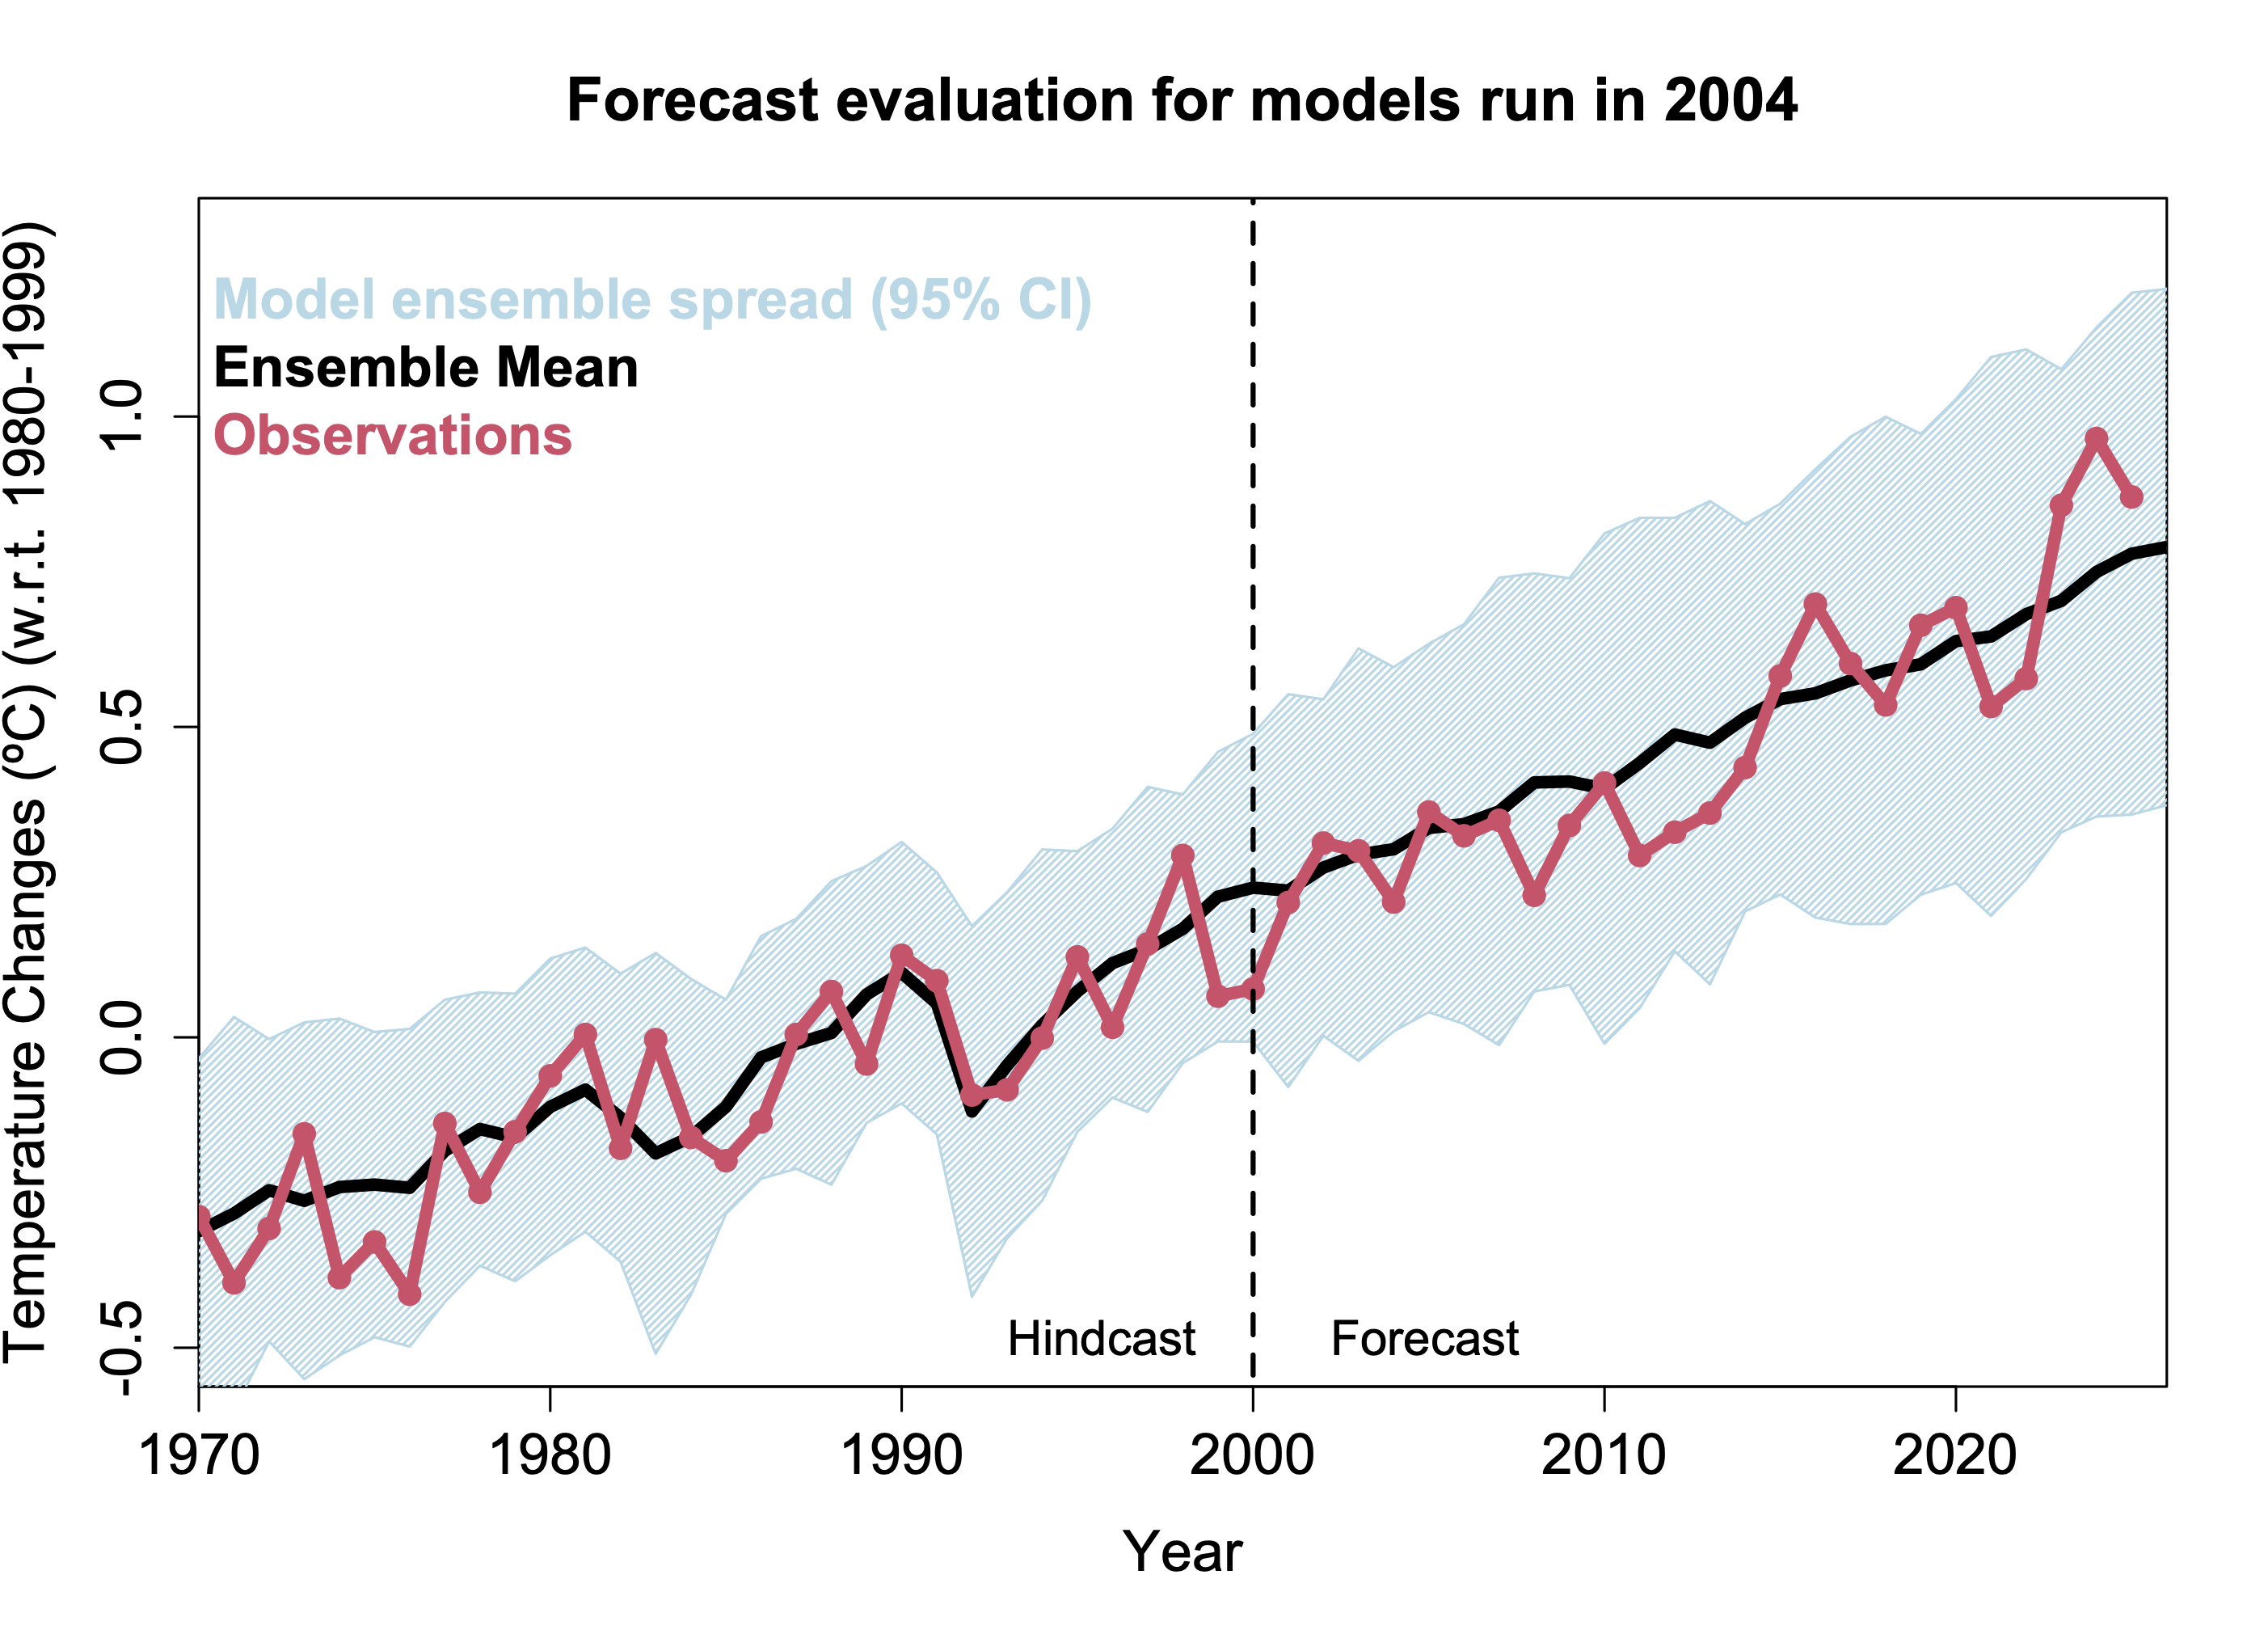
The only thing you trust is one faulty and intentionally misleading chart from 10 years ago, despite it having been forgotten about after it was debunked when it came out. You hold on to one chart like its your bible and no facts can change your feelings about your one true chart.
odd how the term ' debunked' was never taught in science
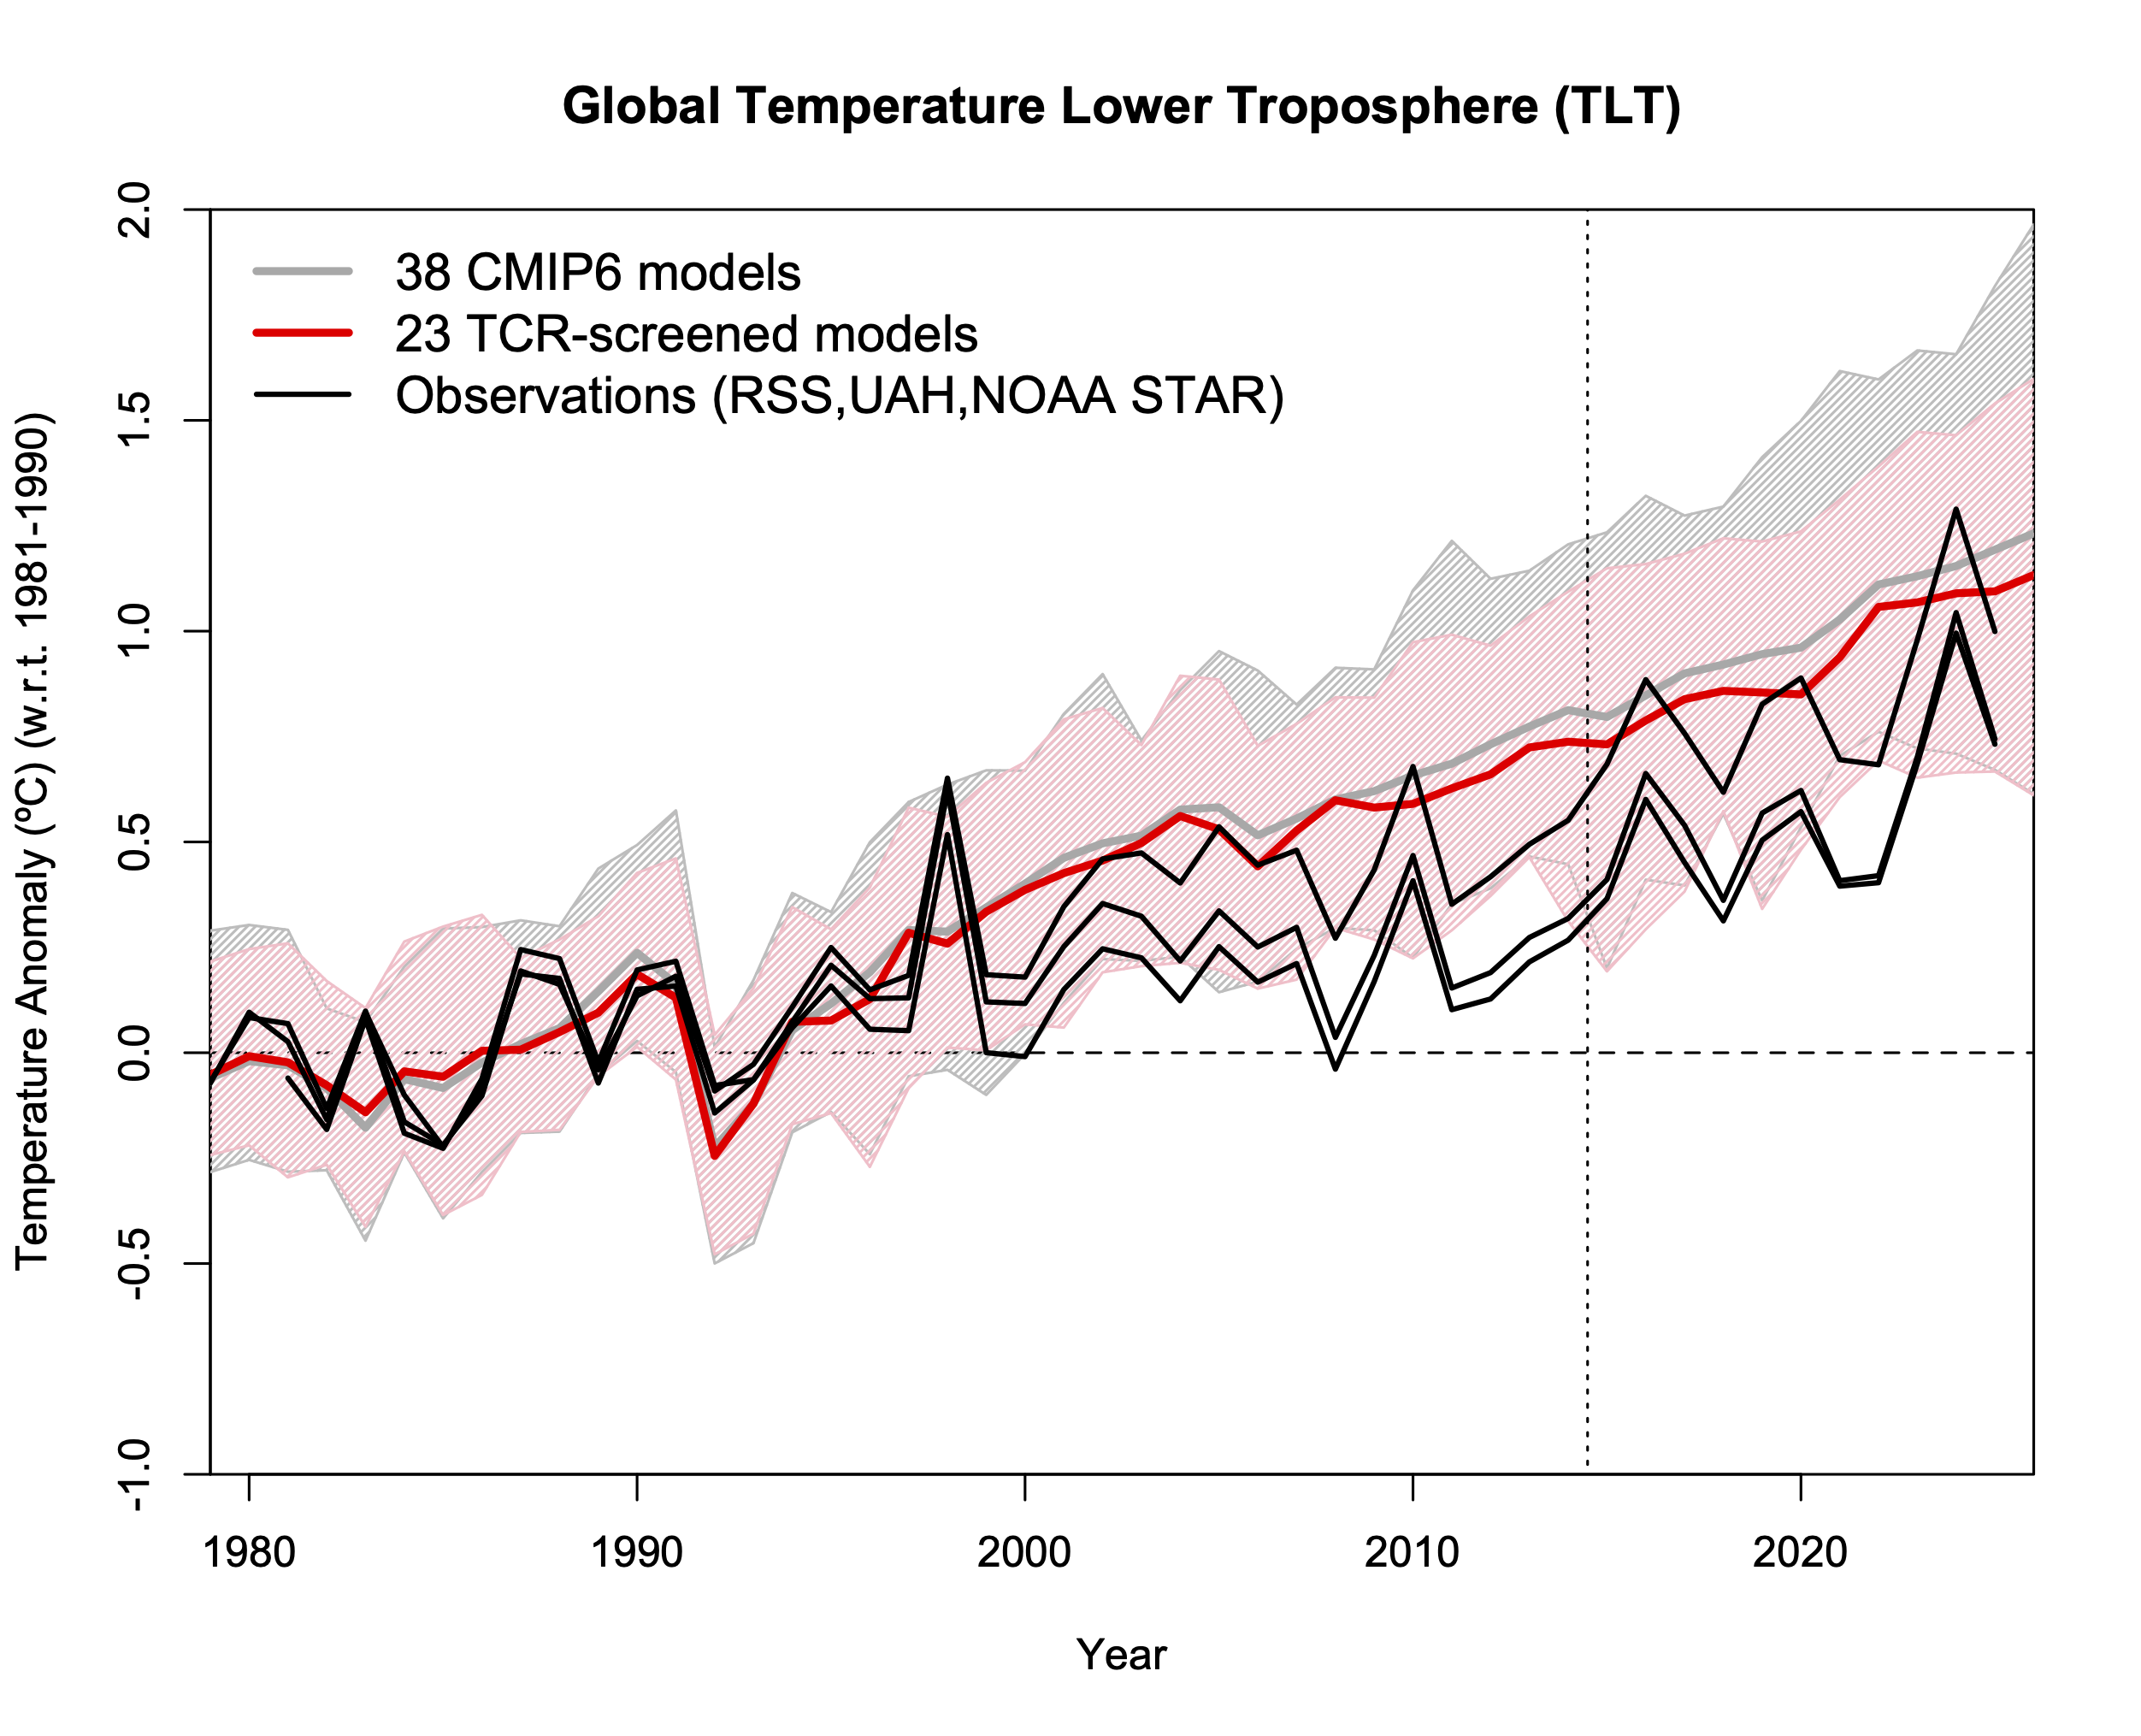
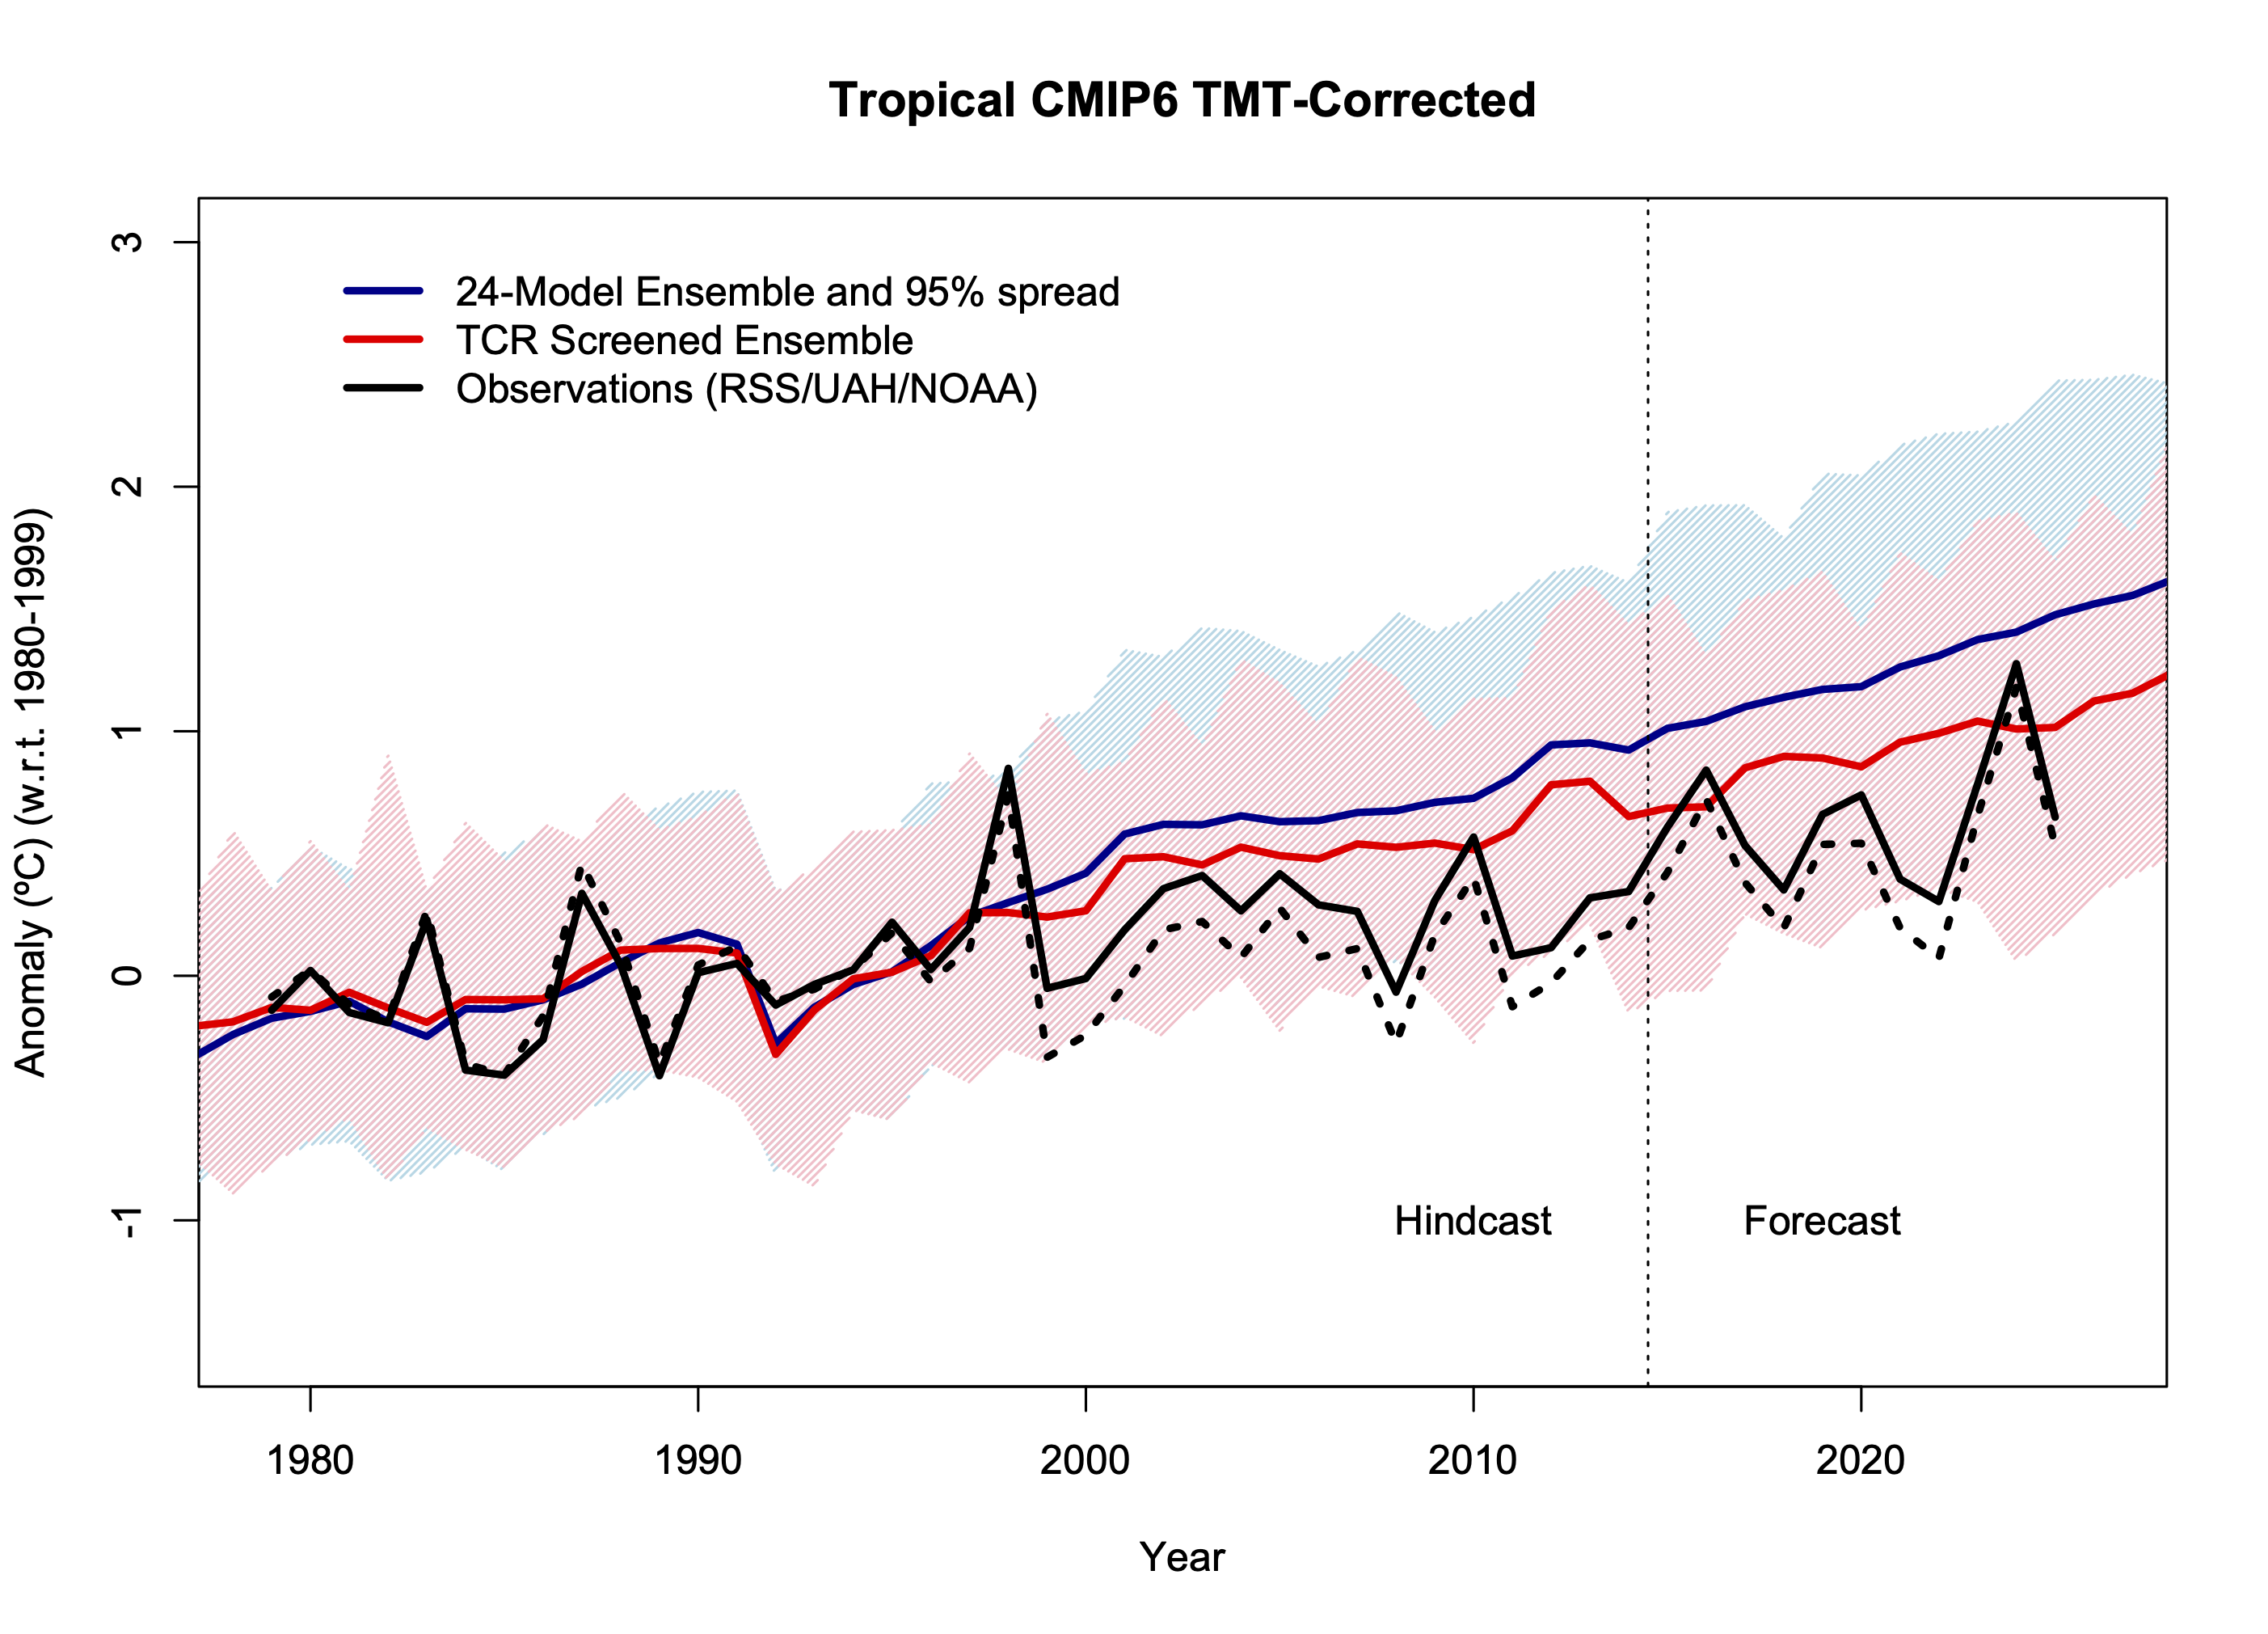
here is the proof the climate models are flawed along with all the climate propaganda based on those climate models

Buddy, you can't even understand the kids explanations of the Greenhouse Effect.
a buddy is someone i respect
you are not my buddy
You should not be talking as if you think you are more of an expert on the climate than all of the IPCC and NASA.
Its idiotic.
i have scientific understanding, you quite obviously do not
you are the very last person to tell anyone what they can or can not say
what is wrong with you ?
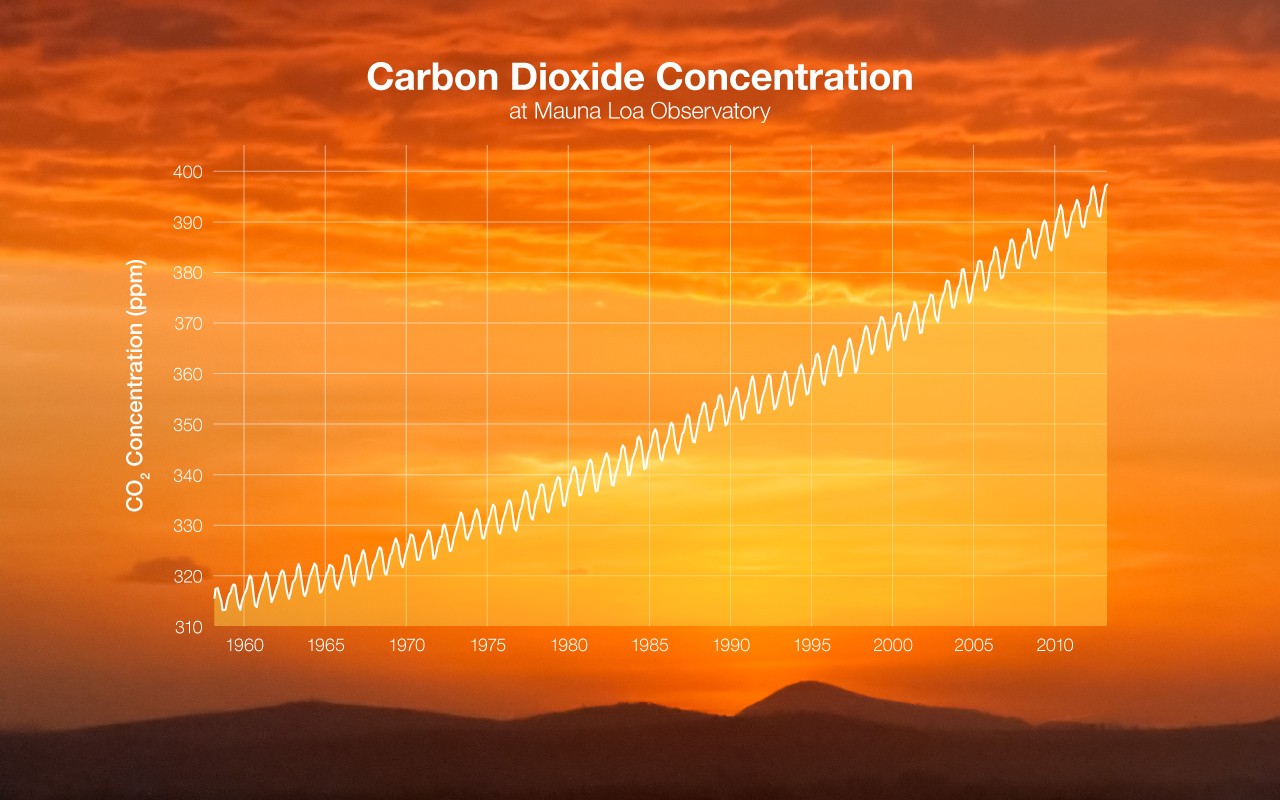
onto the co2 accumulation
i noticed you stay well clear of this ""chart""

a trillion dollars spent on green nonsense and a 2020 lockdown of half the worlds population
and ,the result: no observable effect on the ever increasing co2 levels
no amount of EVs, suspension of freedoms, renewables ,or sequestration is going to stop that accent
the good news is CO2
is not the control knob for our extremely complex , chaotic, non-linear, dynamic climate system
why you avoid this issue is obvious
it undermines your entire flawed narrative and eliminates the need for so called climate action
and the absence of a change in rate in 2020 has another implication for the failed climate alarmism
all in good time