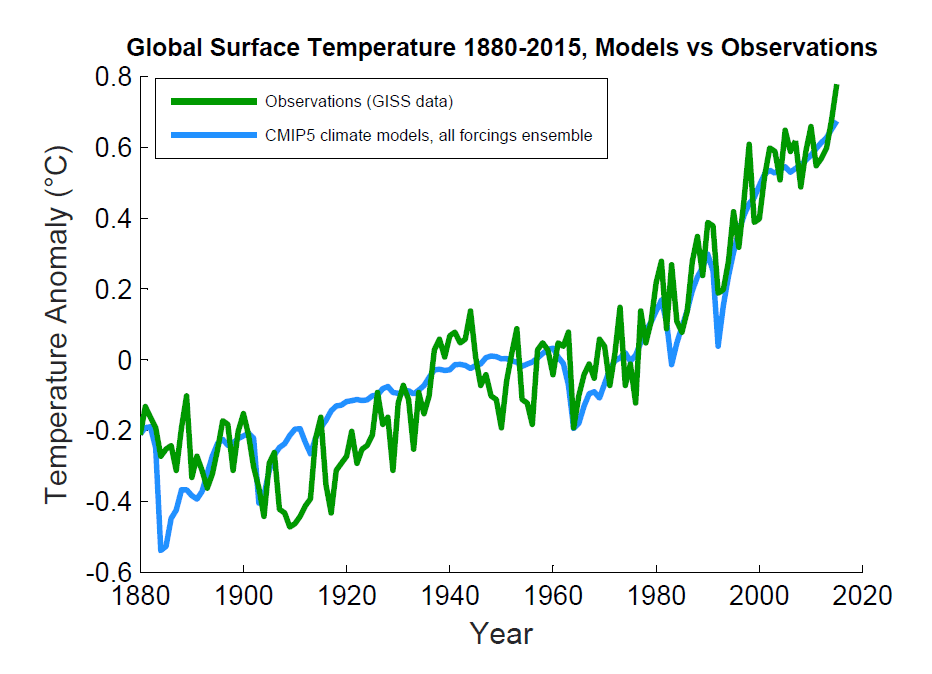
Don't take my word for it. Here are Frankfooter's "updated" numbers for the IPCC's predictions (using the same baseline for calculating the temperature anomalies):I find it interesting from a psychological level how you look at a graph where all the data points are well within the predicted range but claim it is 'spectacularly wrong'.
- IPCC prediction for 2015: 0.85ºC
- 2015 anomaly on the "updated" IPCC graph: 0.75ºC
And that was in a super El Nino year.
The IPCC's predictions remain consistently and spectacularly wrong.
(And since you think you're so clever and that I'm just stubborn, you can look forward to a new thread this weekend where we'll examine your predictions. It will be a lot of fun. :eyebrows
")