

You are using an out of date browser. It may not display this or other websites correctly.
You should upgrade or use an alternative browser.
You should upgrade or use an alternative browser.


Global Warming. Fact or grossly exaggerated??
- Thread starter AK-47
- Start date
You know whats funny about blackrock, he literally has no idea how stupid he is
So again, nothing creditable to add to this thread, keep up the good work.
Now, you're just throwing around baseless insults. Unlike some people on this thread, I knew that the Mann-made graph cited earlier was from 2001, not 2013.
As for Groggy's propaganda chart, you can get him to post it again. I don't spend my time searching the propaganda websites.
If he does post it, you will see the chart shows "adjusted" predictions to account for the new premise that the expected warming went into the deep ocean. The predictions for the surface temperatures were then "adjusted."
But, of course, these "adjustments" were only made after the actual studies of the Earth's temperature were already publicly reported.
Anyone can look good making retroactive "predictions" about past events where the outcomes are already known. For example, you don't have to be a brilliant historian to "predict" whether or not Hitler will win World War II.
--
As for the scientific method, one of the clear standards for a credible theory is that it should allow you to always make reliable predictions.
You can't really say that about the man-made CO2 premise, can you?
Figure you come back with that.
Nothing I posted was untrue, let alone an insult.
As for retroactive thinking, nothing like looking at key holed predictions that don't work out over a really short time frame and saying see the whole GW science is wrong, rotten, biased, or phoney. Remember you claim about 1922 and you claim of 'skyrocketing' temperatures?
Nothing I posted was untrue, let alone an insult.
Your assertion that I read graphs "badly" was an insult.
As for the "skyrocketing" increases, the predictions were made by the IPCC based on Mann's work. The IPCC definitely was wrong.
nothing like looking at key holed predictions that don't work out over a really short time frame and saying see the whole GW science is wrong, rotten, biased, or phoney.
The "per decade" time frames for the predictions were set by the IPCC, not by me. There's nothing improper about holding the IPCC to account for its own predictions. Indeed, believers in science would say that is exactly what we should be doing.
Furthermore, I didn't say the premise was wrong. I said the predictions based on the computer models have been spectacularly wrong, and that we really don't know what impact -- if any -- man-made CO2 has on the climate.
The issue at this point isn't so much that premise has been proven "wrong," but that there's no evidence-based reason at this point to believe that it is right. The correct conclusion is that we don't know, one way or the other, and it's doubtful we will know within our lifetime.
More to the point, by the time the issue is resolved, it is doubtful that economies will still be powered by fossil fuels. So it's not worth worrying about.
Your suggestion that I read graphs "badly" was an insult.
As for the "skyrocketing" increases, the prediction was made by Mann and adopted by the IPCC. They definitely were wrong.
It's clear you read the last one badly, claiming sky rocketing temperature which clearly wasn't the case, so not an insult if true. The end result was within the margin of error, so not as you would like others to think. I'll let the statistical pros on TERB try to explain it in more depth for you if they feel so inclined, bur somehow I doubt any will.
It's clear you read the last one badly, claiming sky rocketing temperature which clearly wasn't the case, so not an insult if true. The end result was within the margin of error, so not as you would like others to think. I'll let the statistical pros on TERB try to explain it in more depth for you if they feel so inclined, bur somehow I doubt any will.
Take another look at the graph. It did predict skyrocketing increases and all of its predictions said that temperatures would be much higher today than what they were in 1997 or 1998.
Completely wrong.
(I'm starting to wonder if you understand the difference between a trajectory and an end result. It is true that the most alarming results are at the 100-year point, but the skyrocketing trajectory that supposedly gets to those dramatic results -- in all of the predictions -- begins at about 1990 and the lines are consistently on skyrocketing trajectories throughout the next 100-plus years.)
Take another look at the graph. It did predict skyrocketing increases and all of its predictions said that temperatures would be much higher today than what they were in 1997 or 1998.
Completely wrong.
(I'm starting to wonder if you understand the difference between a trajectory and an end result. It is true that the most alarming results are at the 100-year point, but the skyrocketing trajectory that supposedly gets to those dramatic results -- in all of the predictions -- begins at about 1990 and the lines are consistently on skyrocketing trajectories throughout the next 100-plus years.)
The predictions were anything, but skyrocketing. All you saw was the extreme models results, not the average result and blasted off yourself. It could only be consider a skyrocket trajectory if it were a cruise missile. I gave the numbers earlier. Can't wait for you to use Mann and skyrocket in one of your posts. I lied, sure I can.
Take another look at the graph. It did predict skyrocketing increases and all of its predictions said that temperatures would be much higher today than what they were in 1997 or 1998.
I am still waiting to see if you can actually read that graph, moviefan.
I repeat the question, how different should the global surface change be from what was predicted on that graph vs reality?
What was their prediction based on that graph?
Can you read a graph at all?
And here's my graph:

Please tell us the differences, if there were changes made, what the predictions were based on this graph.
We all know that a person who can't tell the difference between a creationist, a billion dollar a year lobbyist industry and real science can't answer those basic, high school level questions.
I know you will fail and will just try to change the subject, just as you tried to change the subject when it was shown you couldn't spot a very, very basic change to a IPCC graph that you posted from one of your billion dollar annual subsided ex-tobacco lobbyists.
Go ahead, show us how smart you are.
They wouldnt put their bios and pics up on their website if it wasnt a long-term appointment, smartypants
:
This is going to be fun.
What do you suppose the term 'workshop expert bios' means?
Its right there on the top of the page, on the http://www.aps.org/policy/statements/upload/climate-review-bios.pdfdocument that you supplied and is on the APS website.
Please tell us the differences, if there were changes made, what the predictions were based on this graph.
It's funny how you no longer provide the sources for your charts. However, here's the chart that you provided earlier, which clearly shows the dramatic difference between the IPCC's actual predictions (the line without the "adjustments") and the actual results.
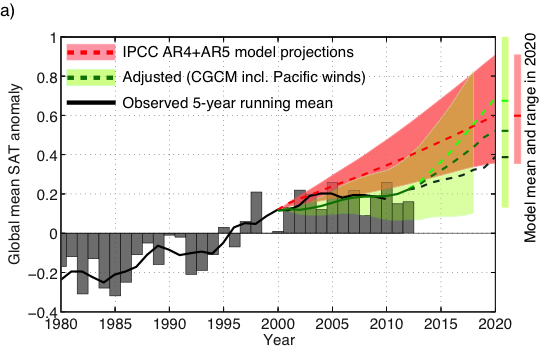
http://www.realclimate.org/index.php/archives/2014/02/going-with-the-wind/#more-16861
Perhaps you can explain why your own charts completely contradict each other.
Never mind that the chart that was done by the Yale Forum on Climate Change and the Media also showed completely different results from your chart, and showed that the models were overwhelmingly wrong. And the study done by the University of Hamburg found that 98 per cent of the models failed to predict the pause.
Finally, we go to the IPCC itself, which said the following (Page 15):
There are, however, differences between simulated and observed trends over periods as short as 10 to 15 years (e.g., 1998 to 2012).
http://www.climatechange2013.org/images/report/WG1AR5_SPM_FINAL.pdf
The IPCC says there are "differences" between what was predicted and what was actually observed. I don't see why you need me to confirm that for you.
Furthermore, the IPCC is completely at odds with whoever produced your un-sourced chart.
And do we have a theory that better explains global warming than CO2 or is this still the same argument used to 'disprove' evolution?
It's funny how you no longer provide the sources for your charts. However, here's the chart that you provided earlier, which clearly shows the dramatic difference between the IPCC's actual predictions (the line without the "adjustments") and the actual results.
http://www.realclimate.org/index.php/archives/2014/02/going-with-the-wind/#more-16861
Perhaps you can explain why your own charts completely contradict each other.
Never mind that the chart that was done by the Yale Forum on Climate Change and the Media also showed completely different results from your chart, and showed that the models were overwhelmingly wrong. And the study done by the University of Hamburg found that 98 per cent of the models failed to predict the pause.
Finally, we go to the IPCC itself, which said the following (Page 15):
http://www.climatechange2013.org/images/report/WG1AR5_SPM_FINAL.pdf
The IPCC says there are "differences" between what was predicted and what was actually observed. I don't see why you need me to confirm that for you.
Furthermore, the IPCC is completely at odds with whoever produced your un-sourced chart.
The prediction can be off because as mentioned on more than one occasion unseen occurrences like volcanoes mass fires and earthquake.We are still waiting for the big one on the west coast. The adjustment is clearly explained, taking in CGCM (look that one up) westerly winds predictions that weren't included in the original, big deal. Certainly not the conspiracy you make it out to be.
What do you think the word "expert" means, groggy?? This is gonna be fun.This is going to be fun.
What do you suppose the term 'workshop expert bios' means?
Its right there on the top of the page, on the http://www.aps.org/policy/statements/upload/climate-review-bios.pdfdocument that you supplied and is on the APS website.
And you never answered my previous question, why do you think APS has suddenly appointed 3 climate skeptics to their panel?? Do you think they just did that for the heck of it, so they can have a brief discussion??
What do you think the word "expert" means, groggy?? This is gonna be fun.
And you never answered my previous question, why do you think APS has suddenly appointed 3 climate skeptics to their panel?? Do you think they just did that for the heck of it, so they can have a brief discussion??
To some an expert means a 'has been drip'. He may not have answered it because I did.
i like warm weathers
Unfortunately on a global scale, it would be bad for about 7 billion humans.
And do we have a theory that better explains global warming than CO2 or is this still the same argument used to 'disprove' evolution?
There is no empirical evidence to support the premise of "global warming" as the warmists define it. Computer model projections are not evidence.
But if you are asking whether we have a better theory that explains changes in the climate, you may want to take a look at all of the changes that occurred in the climate prior to the industrial revolution.
The prediction can be off because as mentioned on more than one occasion unseen occurrences like volcanoes mass fires and earthquake.We are still waiting for the big one on the west coast. The adjustment is clearly explained, taking in CGCM (look that one up) westerly winds predictions that weren't included in the original, big deal.
Spectacularly "off," in this case.
In any event, I'm not sure how you explain Groggy's competing graphs -- particularly since he has claimed that both of the contradictory graphs support his position on "the science."
Spectacularly "off," in this case.
In any event, I'm not sure how you explain Groggy's competing graphs -- particularly since he has claimed that both of the contradictory graphs support his position on "the science."
A GMSATA of <0.3 by 2020, over 25 yers is not what I would call spectacular, but maybe in your limited view of the world, every little bit is a victory.

