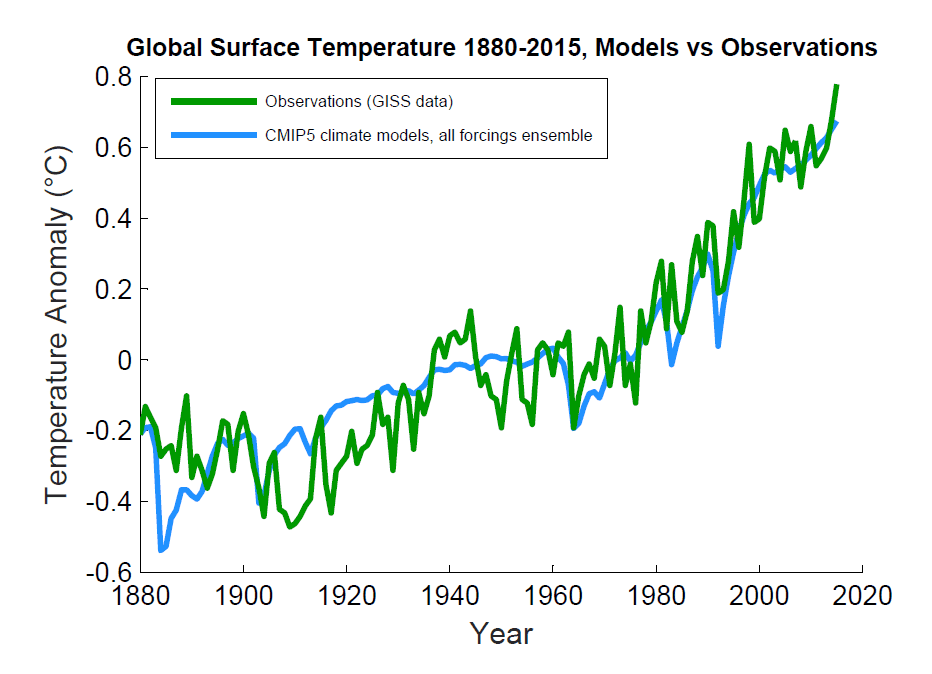
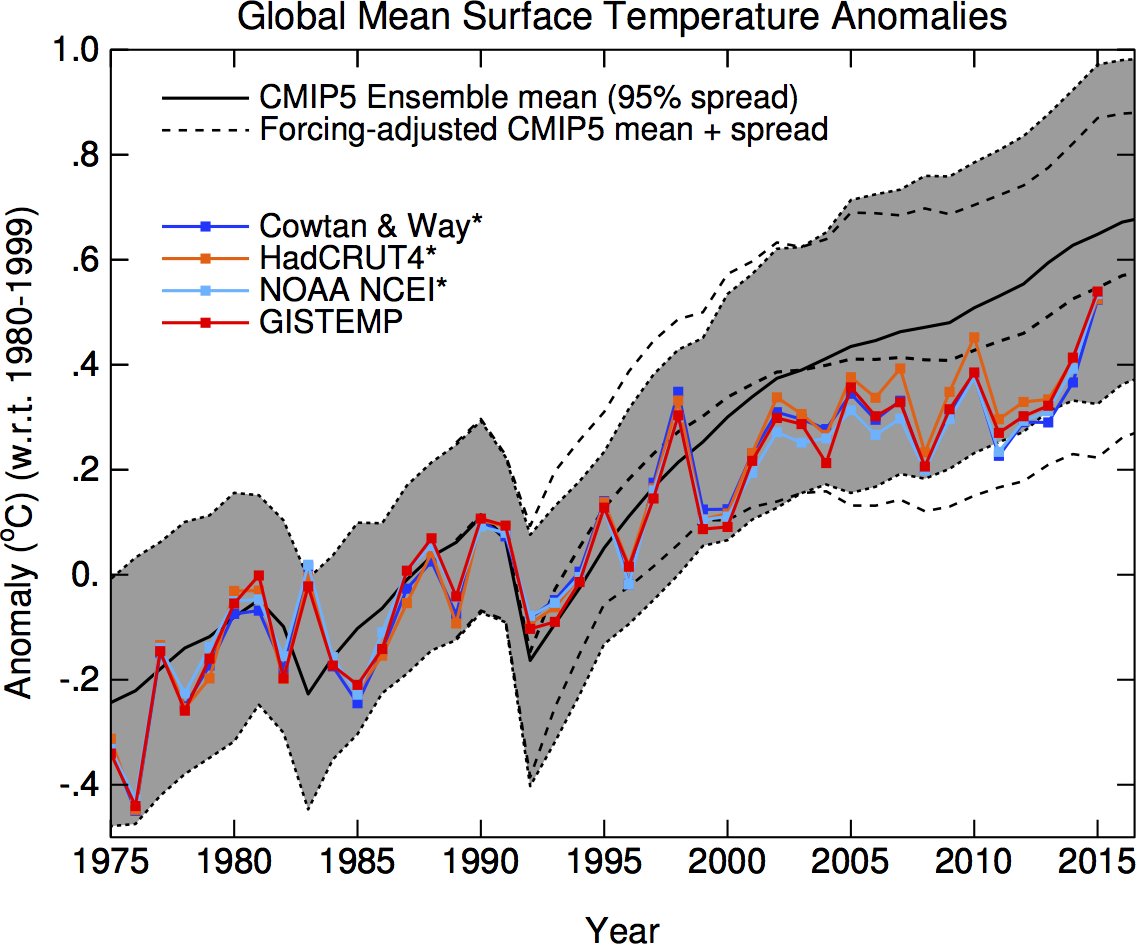
I find it interesting from a psychological level how you look at a graph where all the data points are well within the predicted range but claim it is 'spectacularly wrong'.
Don't take my word for it. Here are Frankfooter's "updated" numbers for the IPCC's predictions (using the same baseline for calculating the temperature anomalies):
- IPCC prediction for 2015: 0.85ºC
- 2015 anomaly on the "updated" IPCC graph: 0.75ºC
And that was in a super El Nino year.
The IPCC's predictions remain consistently and spectacularly wrong.
(And since you think you're so clever and that I'm just stubborn, you can look forward to a new thread this weekend where we'll examine your predictions. It will be a lot of fun. :eyebrows