

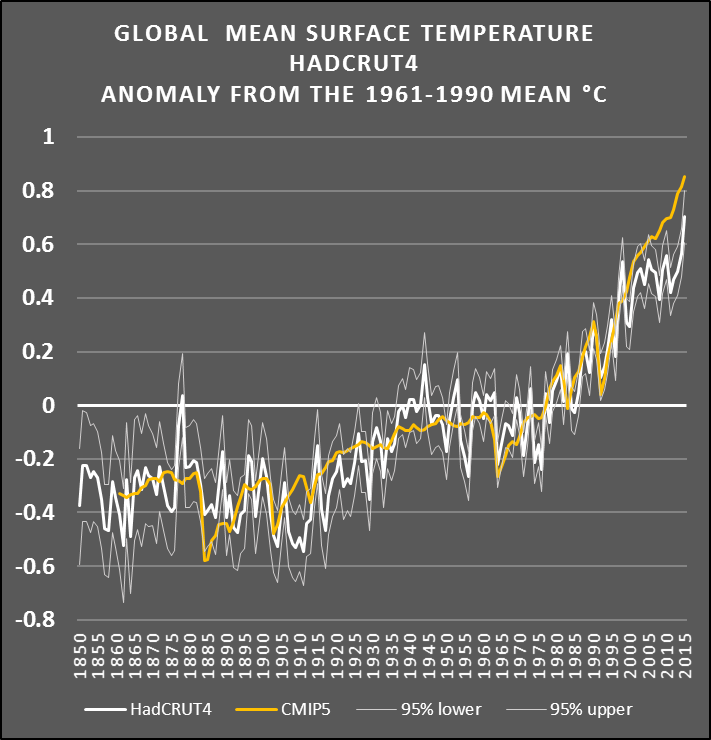
Here's the graph you are still unable to read.
The one that shows how accurate the IPCC's projections are.
I like that graph. It confirms the IPCC's predictions have been spectacularly wrong.


Here's the graph you are still unable to read.
The one that shows how accurate the IPCC's projections are.
Somebody should definitely feel embarrassed, but it's not me.
The temperature anomalies fit within the range of the models.
That's because he knows the temperature at the end of 2015 won't be anywhere near what the IPCC predicted.
I like that graph. It confirms the IPCC's predictions have been spectacularly wrong.
You lie repeatedly about the IPCC's projections and are in the process of losing a bet over the same issue, despite admitting that their projections are correct.
Wrong.
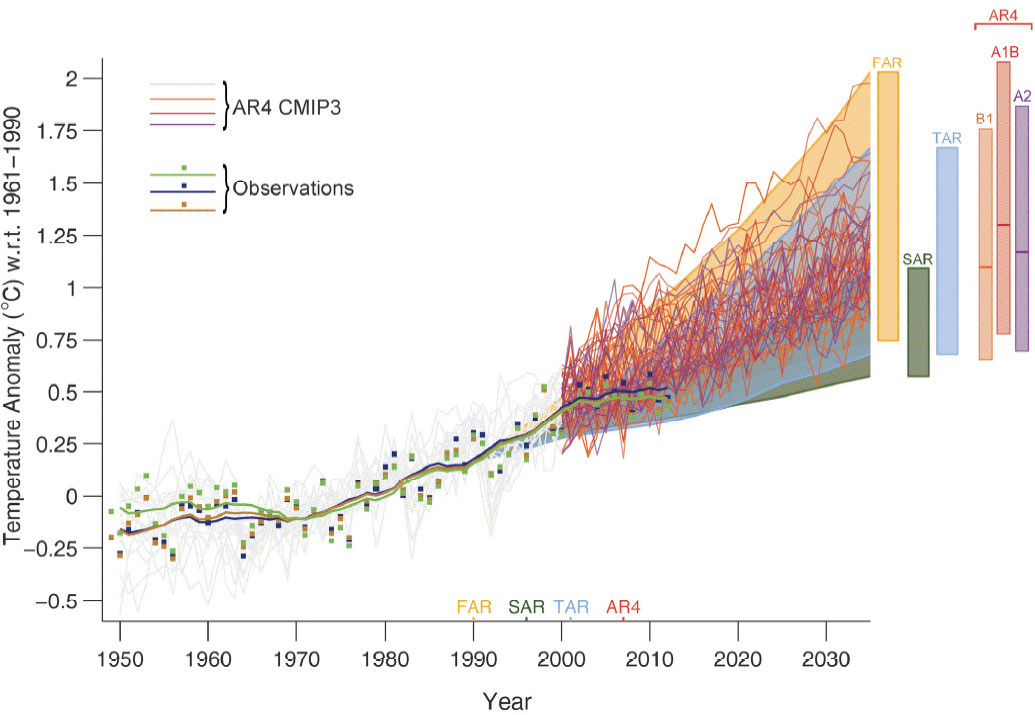
The temperature anomalies fit within the range of the models. More specifically, the models that projected that huge increases in man-made greenhouse gases wouldn't lead to any significant warming were correct.
However, the IPCC's predictions -- such as the 2007 prediction of a 0.2 degrees C per decade increase -- were based on the average of the models.
The IPCC's predictions have been spectacularly wrong. The graphs confirm it:
National Post: http://financialpostbusiness.files.wordpress.com/2014/06/fe0617_climate_c_mf.jpeg?w=620&h=552
The Guardian: https://pbs.twimg.com/media/CIRz_2PVEAAf8QX.jpg:large
Still can't read a graph, eh?
I sure can.
According to your graph, the number of times that the white line intersects with the gold line in the 21st century: Zero.
That means the IPCC's predictions have been spectacularly wrong.
Hilarious. Here's the full quote of what I said.
.
2015 is the intersection of your 'gold and white' lines on that chart, with today's temperatures right on the projection.
I love that you post two charts that prove that the projections are accurate, as soon as you add in this years data.
According to your graph, this year's data show the predictions continue to be wrong.
There was about half a billion in money funnelled into denier lobbyists over about a decade.
http://www.scientificamerican.com/article/dark-money-funds-climate-change-denial-effort/
The side of science spends money on research, but its not allowed to spend it on anything other then research, for the most part.
NOAA puts the 2015 year to date anomaly at 0.86ºC
OMG! Where did you learn how to plot numbers on a graph -- from Basketcase?
Rather than mixing and matching numbers from different data sets that are using completely different baselines, how about sticking with the HadCRUT4 data that has actually been plotted on your graph. It shows the temperature anomaly for 2015 to be well below what the IPCC predicted, even in this strong El Nino year.
Your graph confirms it -- the IPCC's predictions have been spectacularly wrong.
Up until Sept the HadCrut4 anomaly is 0.79ºC, which puts it just below your gold line, and when Oct's data comes out I expect it will be even closer.


So, now you're claiming that the chart that you have been repeatedly posting is completely wrong.
Ok, I made a mistake, apologies.
The year to date for Hadcrut4.4.0 is 0.713ºC, posted here in column 2.
http://www.metoffice.gov.uk/hadobs/...time_series/HadCRUT.4.4.0.0.annual_ns_avg.txt
The Hadcrut numbers are lower then NOAA and NASA in general, since they include sea surface temperature while the others do air temperatures.
You really don't know what you're talking about. They all include sea surface temperatures.
The difference is they use different baselines as their starting point for comparing the anomalies.
Yup. That's what it showed in the graph you initially posted. And the 2015 anomaly is nowhere near what the IPCC predicted, as your graph also shows.
The IPCC's predictions have been spectacularly wrong.
The temperature anomalies fit within the range of the models.
You keep saying that, but the chart shows you wrong...

