Toronto Escorts

Good Morning. It's 65 Degrees in Antarctica.

Charlemagne

Well-known member
Jul 19, 2017
15,451
2,483
113
Good Morning. It's 65 Degrees in Antarctica.

That's warmer than Orlando today.

By Alex Lubben

Feb 7 2020, 11:16am

You could be walking around Antarctica in a T-shirt.

A record-breaking temperature reading taken at an Argentinian research station on the continent Thursday clocked in at 18.3 degrees Celsius — 65 degrees Fahrenheit — warmer than it is right now in Orlando, Florida, and the hottest temperature ever recorded in Antarctica.

The reading was from a station on Esperanza, the peninsula on the northern tip of Antarctica that’s been recording temperature data since 1961. As the planet heats, the poles are getting hotter way faster than the rest of the world. Hotter temperatures mean melting ice, which makes sea levels rise and threatens populations and economies around the world.

The U.N. is aiming to keep global temperatures from rising more than 2 degrees Celsius. Already, the world has warmed by about 1 degree Celsius above pre-industrial levels. But at the poles, things are heating up way faster. There, it’s warmed by more than 3 degrees. And records are continuously being broken at a rate that has even scientists alarmed.

The last record-breaking temperature reading in Esperanza was taken only five years ago, on March 24, 2015. Then it was 17.5 degrees Celsius, about 63 degrees Fahrenheit. Thursday’s reading broke that record by nearly a full degree.

“To have a new record set that quickly is surprising, but who knows how long that will last? Possibly not that long at all,” James Renwick, a climate scientist at Victoria University of Wellington in New Zealand, told the Guardian.

WMO | OMM
✔
@WMO
The Argentine research base Esperanza, on the northern tip of #Antarctic Peninsula, saw a new record temperature of 18.3°C today (old one 17.5°C on 24 March 2015), per @SMN_Argentina.
Details of previous record at https://bit.ly/2ugiXYE #ClimateChange

View image on Twitter
675
3:47 PM - Feb 6, 2020
Twitter Ads info and privacy
930 people are talking about this

What happens at the poles, unfortunately, doesn’t stay at the poles. The warming in Antarctica is melting glaciers and ice sheets at a record pace.

As ice sloughs off into the sea, it’ll raise sea levels around the globe. The ice sheets on Antarctica are currently losing 127 gigatonnes of mass every year, according to NASA. Imagine dropping 20,000 Great Pyramids of Giza into the oceans — that’s about how much ice is falling off the continent annually. Scientists recently recorded temperatures 2 degrees Celsius above freezing in the water at the base of one of the fastest-melting glaciers on the continent.

Some of the glaciers there are melting fast enough that lakes are forming on top of the glaciers. Last month, the British endurance swimmer Lewis Pugh swam in one of them — in a Speedo and a swim cap.

https://www.vice.com/en_us/article/4agaj3/good-morning-its-65-degrees-in-antarctica
 

Frankfooter

dangling member
Apr 10, 2015
80,566
17,828
113
And here is why
Hey larue.

Where did that chart come from?
What data and research backs it and makes you think its correct?

If its from that 2011 Lindzen and Choi study, the science behind that claim was shown wrong a decade ago and the paper those numbers come from were rejected for publishing due to massive errors.
Not that you'd ever check your sources first to see if they are legit.
 

JohnLarue

Well-known member
Jan 19, 2005
16,329
2,262
113
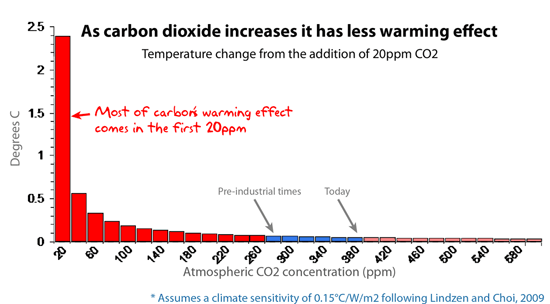
Serious question, why does most of the warming effect come in the first 20ppm??
Like so many things in nature infrared absorption by organic compounds has a logarithmic relationship to concentration

log (Io/I) = ElC with C being concentration

A logarithm is the inverse function of an exponent
So instead of exponential growth, you get diminishing returns as concentration is increased
 

JohnLarue

Well-known member
Jan 19, 2005
16,329
2,262
113
Hey larue.

Where did that chart come from?
What data and research backs it and makes you think its correct?

If its from that 2011 Lindzen and Choi study, the science behind that claim was shown wrong a decade ago and the paper those numbers come from were rejected for publishing due to massive errors.
Not that you'd ever check your sources first to see if they are legit.
it is basic high school math & first or second year chemistry

We went down this road before, you lost badly
You cant remember? Well it is because you did not understand it.
 
O

OnTheWayOut

Everyone knows Argentinians make lousy thermometers! :behindsofa:
 

Frankfooter

dangling member
Apr 10, 2015
80,566
17,828
113
it is basic high school math & first or second year chemistry
.
That explains why you got it wrong.

I do love how you use 10 year old links all the time, it really shows how up to date on the research and science you are.
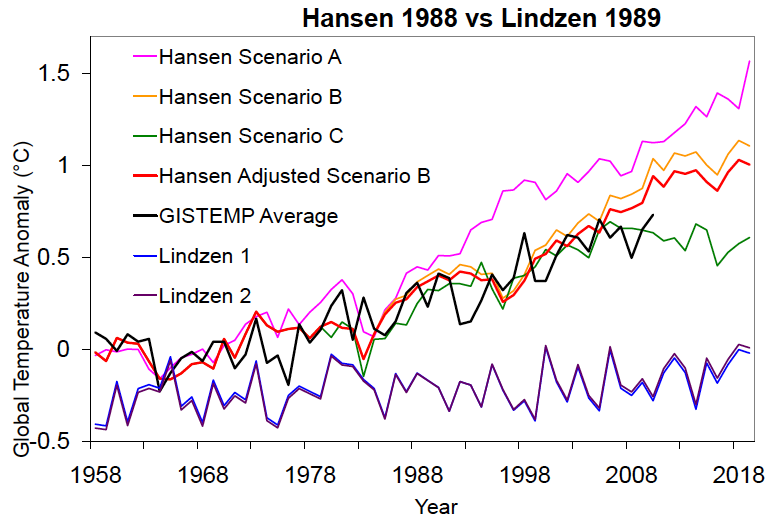
Hey, since you continually say the way to evaluate hypothesis is through data, why not check on the accuracy of Lindzen's projections, since he's the one that came up with the numbers you posted in comic sans.


Yup, looks like Lindzen is a total failure at science and projections, just like you.
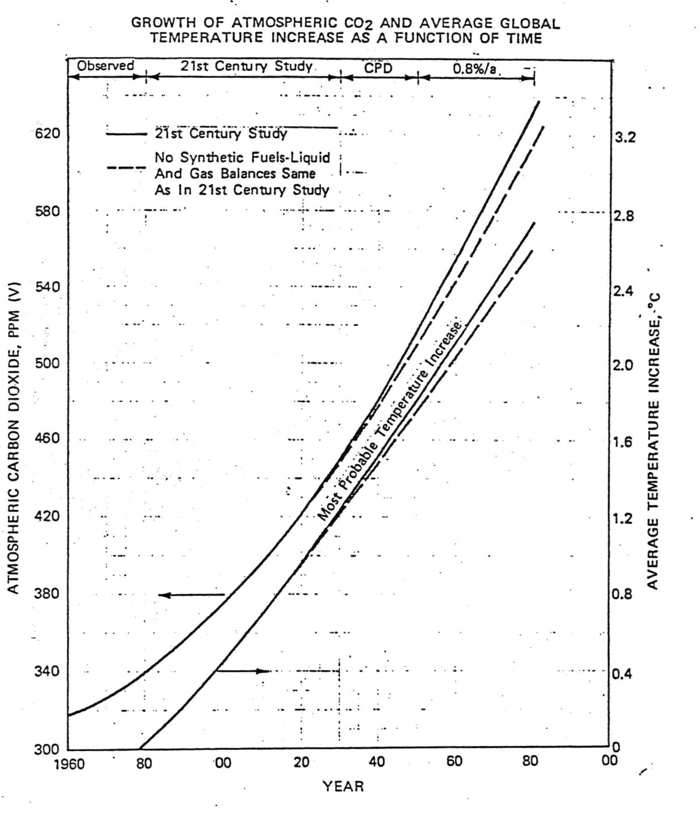
Oh, and for total bonus, why don't we compare those projections against Exxon's own 1980 projection for climate change.


Yup, looks like Exxon and the IPCC knew what was going to happen and your guy, Lindzen (who is paid by Exxon and the Heartland Institute to spread disinformation) was bullshitting.
tsk, tsk.
 

JohnLarue

Well-known member
Jan 19, 2005
16,329
2,262
113
That explains why you got it wrong.
I do love how you use 10 year old links all the time, it really shows how up to date on the research and science you are.
10 years....... ah no ...... the logarithmic relation between absorption and concentration was discovered and established 150 years ago

From the source for your little attack grapgh
https://skepticalscience.com/exponential-increase-CO2-warming.htm

What the science says...
Despite the logarithmic relationship between CO2 and surface temperatures, atmospheric CO2 levels are rising so fast that unless we dramatically decrease our emissions, global warming will accelerate over the 21st Century.
There is a logarithmic relationship between radiative forcing (which is directly proportional to the change in surface temperature at equilibrium) and the atmospheric CO2 increase. Note that we are not currently at equilibrium as there is a planetary energy imbalance, and thus further warming 'in the pipeline' from the carbon we've already emitted. Therefore, estimates of the rate of warming due to CO2 thus far will will be underestimates, unless accounting for this 'warming in the pipeline'.
So your source acknowledges the logarithmic relationship & validates the chart in post #4

His incorrect argument is that there is "further warming 'in the pipeline' from the carbon we've already emitted" ?????
C02 is not the source of the energy, the infrared radiation is
And that radiation is finite
Water vapour and to a far less extent other greenhouse gases absorb most of this energy and all of it at specific wavelengths and then re-emit it instantaneously
Adding more Co2 is incremental with diminishing returns for each incremental addition

Absorption of electromagnetic radiation is instantaneous ( ie the speed of light), so how can there be a pipeline of energy ("further warming") ?
He has an inventory of built up energy in his pipeline in the atmosphere? Energy travelling at the speed of light has been stored up in a pipeline??? I do not think so


And he tries to justify this by claiming there is a planetary energy imbalance???
His energy balance equation does not balance (likely because he ignores photosynthesis, turbulence and the impact of clouds) and he instead thinks energy traveling at the speed of light is being stored up in the atmosphere?

Wrong !
And it is a piss poor attempt to mislead others
Well at least his font is not comic sans font, so if that is what you use as your standard for your scientific understanding...........????
 

Frankfooter

dangling member
Apr 10, 2015
80,566
17,828
113
10 years....... ah no ...... the logarithmic relation between absorption and concentration was discovered and established 150 years ago
Yes, 10 years ago.
Your chart comes from data from a failed, 10 year old paper by Lindzen.
A paper that he couldn't get published until he went to some obscure, pay to publish, Korean journal.
There it died and its theories died with them.

Nobody takes that work seriously, just as nobody takes Lindzen seriously as he is funded by Exxon and the Heartland Institute and nobody takes you seriously because you can't even tell the difference between Fahrenheit and Celsius on a chart.

Both of those charts posted above show that Lindzen's predictions failed miserably, with even a 50 year old Exxon prediction looking way more accurate.
And of course you are totally unaware of those facts.
 

JohnLarue

Well-known member
Jan 19, 2005
16,329
2,262
113
Yes, 10 years ago.
Once again , no,,,,,,,,,,,, the logarithmic relationship between absorption & concentration has been know since approx 1850


Your chart comes from data from a failed, 10 year old paper by Lindzen.
You are calling Richard Lindzen a failure?

He was the top climate dog at MIT
written over 200 papers & books

https://en.wikipedia.org/wiki/Richard_Lindzen
Richard Siegmund Lindzen (born February 8, 1940) is an American atmospheric physicist known for his work in the dynamics of the middle atmosphere, atmospheric tides, and ozone photochemistry. He has published more than 200 scientific papers and books. From 1983[1] until his retirement in 2013, he was Alfred P. Sloan Professor of Meteorology at the Massachusetts Institute of Technology.[2]
You Frankfooter( who cant read a grade six level chart) are calling Richard Lindzen a failure ?
He was a lead author of Chapter 7, "Physical Climate Processes and Feedbacks," of the Intergovernmental Panel on Climate Change's Third Assessment Report on climate change. He has criticized the scientific consensus about climate change[3] and what he has called "climate alarmism."[4]
You are calling Richard Lindzen a failure and yet claim the IPCC is the best of the best?

He quit the IPCC in disgust as he saw it as political organization, who was pushing an agenda

A paper that he couldn't get published until he went to some obscure, pay to publish, Korean journal.
There it died and its theories died with them.
That appears to be what you want. Too bad for you theories & the truth do not stay buried
Say wasnt that about the time (ie climate gate) when that Dr jones dude in East Anglia university was sending emails about preventing papers from making past peer review..... no matter what it takes?

Nobody takes that work seriously, just as nobody takes Lindzen seriously as he is funded by Exxon and the Heartland Institute and nobody takes you seriously because you can't even tell the difference between Fahrenheit and Celsius on a chart.
No Franfooter. It is you nobody is taking seriously

Both of those charts posted above show that Lindzen's predictions failed miserably,
How in the world would you know that?
You can not read a grade six level chart with explicit labels

with even a 50 year old Exxon prediction looking way more accurate.
And of course you are totally unaware of those facts.
I though you were dead set against any and all scientific research that is paid for by oil money?

Again, watching you arguing scientific theory is like watching a turtle who has been flipped on his back.
It is assuming, but it is also cruel


Frankfooter

dangling member
Apr 10, 2015
80,566
17,828
113
Once again , no,,,,,,,,,,,, the logarithmic relationship between absorption & concentration has been know since approx 1850
]
Yes, but Lindzen got it wrong.

You are calling Richard Lindzen a failure?
I'm calling his work a failure, the paper that you sited for your comic sans chart.
That same work that failed to project future climate change, which is what you said previously is the only way to judge the science and/or hypothesis.

Here's the proof.


The work you quoted resulted in a failed prediction for climate change while the work I quote was accurate.
You're failing by the standards you set.
 

JohnLarue

Well-known member
Jan 19, 2005
16,329
2,262
113
I'm calling his work a failure, the paper that you sited for your comic sans chart.
That same work that failed to project future climate change, which is what you said previously is the only way to judge the science and/or hypothesis.
You have never read his paper, so you are no authority on his work.
Even if you did read. No way in hell you would understand it
You can not read a grade six level chart. His work is quite a bit more advanced than that


A chart from skeptical science ?
Same guy who believes there is a pipeline of energy stored in the atmosphere carbon dioxide because his energy balance equation does not balance?
Vs, The top climate dog at MIT who has over 200 peer reviewed papers & books?

Time to put your dunce cap back on Frankfooter

The work you quoted resulted in a failed prediction for climate change while the work I quote was accurate.
You're failing by the standards you set.
The logarithmic relationship between absorption and concentration has been known for 150 years
You think you can make that go away by slandering an extremely well respected scientist ?

Please slither away


Frankfooter

dangling member
Apr 10, 2015
80,566
17,828
113
A chart from skeptical science ?
Larue, you posted a chart using comic sans from an 11 year old, failed paper.
You can't tell a legit source from wattsupwiththat.

I did your work for you and sourced out that chart to Lindzen and Choi LC09, 2009.
That paper was refused publishing in peer assessed journals due to major problems, for instance extrapolating data from the tropics as if it were the same in all regions of the globe.
Realclimate covers it better and more articulately than I can.

LC09 misinterpret air-sea interactions in the tropics The main changes in tropical SST and radiative fluxes at TOA are associated with El Niño-Southern Oscillation (ENSO) and are not necessarily indicative of forced variability in a closed system. ENSO events cause strong and robust exchanges of energy between the ocean and atmosphere, and tropics and subtropics. Yet LC09 treat the tropical atmosphere as a closed and deterministic system in which variations in clouds are driven solely by SST. In fact, the system is known to be considerably more complex and changes in the flow of energy arise from ocean heat exchange through evaporation, latent heat release in precipitation, and redistribution of that heat through atmospheric winds. These changes can be an order of magnitude larger than variability in TOA fluxes, and their effects are teleconnected globally. It is therefore not possible to quantify the cloud feedback with a purely local analysis.
More robust methods show no discrepancies between models and observations. In TFOW, we compute correlations and regressions between tropical SSTs and top-of-atmosphere (TOA) longwave, shortwave and net radiation using a variety of methods. LC09 found the observed behavior to be opposite from that of 11 atmospheric models forced by the same SSTs and conclude that the models display much higher climate sensitivity than is inferred from ERBE. However, in our analysis comparing these relationships with models, we are unable to find any systematic model bias. More importantly, the nature of these relationships in models bears no relationship to simulated sensitivity. That is, the metric developed by LC09 is entirely ineffective as a proxy for simulated sensitivity.

LC09 have compared observations to models prescribed with incomplete forcings. The AMIP configuration in the model simulations used by LC09 have incomplete forcings. The AMIP protocol started off a test only of how an atmospheric model reacts to changes in ocean temperatures, and so models often only use the ocean temperature change when doing these kinds of experiments. However, over the period of this comparison, many elements – greenhouse gases, aerosols, the sun and specifically, volcanoes changed the radiative fluxes, and this needs to be taken into account. Some models did this in these experiments, but not all of them.For instance, the dominant source of variability in the reflected solar flux arises from aerosols associated with the eruption of Mount Pinatubo in June of 1991 yet all but 2 model simulations examined by LC09 omit such forcings entirely. Other radiative species are absent from the models altogether. It is thus obviously inappropriate to expect such model simulations to replicate observed variability in TOA fluxes.

LC09 incorrectly compute the climate sensitivity. By not allowing for the black body radiation (the Planck function) in their feedback parameter, LC09 underestimate climate sensitivity. Using the correct equations, LC09 should obtain a feedback parameter and climate sensitivity of -0.125 and 0.82 K, respectively, rather than their values of -1.1 and 0.5 K. In contrast, TFOW results yield a positive feedback parameter and greater sensitivity estimate, though we also caution that this approach is not a valid technique for estimating sensitivity, as a closed and therefore global domain is essential (though not by itself sufficient). Lastly, LC09 fail to account for variability in forcings in estimating sensitivity.
http://www.realclimate.org/index.php/archives/2010/01/lindzen-and-choi-unraveled/

Now that I've posted the specific issues its time for you to either prove why those claims are wrong, with direct quotes from Lindzen and Choi, backed with the data and formulas to show why its correct.
Anything less than we'll understand you to be that kind of blowhard at the party that rants on and on about logarithmic relationships while missing the point that Lindzen and Choi made several other, massive errors that doomed their work.
 
Toronto Escorts