
Curious that the press isn't talking about Alaska any more
https://pbs.twimg.com/media/EPJVg5LVAAAojcu?formaG][/QUOTE]
Still can't tell the difference between weather and climate?
That's pretty sad.


Only Three Months Left For Planet Earth( and other false doomsday predictions)
- Thread starter canada-man
- Start date
The baseline chosen is exactly the same baseline (1981-2010) as the one in your surface temperature mess, You know your propaganda piece entitled "How are climate model projections doing?"Yes, mr science, that data point departs downward because it was cooler and the warming has continued through the entire range of your chart.
Now you are arguing that a 0.56ºC warming in 10 years from your 1981-2010 average doesn't show any warming?
And you are arguing that because it uses the average as zero there was no warming during 1981-2010?
So therefore the fact that the chart starts below zero doesn't count?
That's really fucked up attempts at logic larue, you'd fail grade 9 with that thinking.
Your chart shows that there was warming during your 1981-2010 period and that the zero point shows that the warming has continued and is now very similar to warming on the surface.
Two simple questions mr science.
1) Do you think that your chart shows no warming during the baseline period, 1981-2010?
2) Why do you accept data that 'departs upwards' at the end of your chart as showing warming but ignore data that 'departs downwards' at the start that shows even more continual warming?
The hilarious, dunning-kruger, part of this debate is that you think you're making winning arguments larue.
It is a standard operating procedure in climate science to use a thirty year average as a reference baseline period
Time to face some facts Frank, primarily the fact you lack the training, understanding, intelligence and just plain common sense to read a grade six level graph
Odd how you post graph after graph after graph in your comical attempt to mislead others, yet you cant read one
perhaps you can get gretta to explain graph reading to you. I believe she got past grade six
Not quite as sad as you not being able to read a grade six level temperature anomaly graphStill can't tell the difference between weather and climate?
That's pretty sad.
You do not have the first loose clue about what you preach about
Despicable
WRONG.The baseline chosen is exactly the same baseline (1981-2010) as the one in your surface temperature mess,
The Gavin Schmidt, NASA, chart has a baseline of 1980-1999.
Even so, it shows about the same amount of warming as your chart, which you claims disproves climate change.
Duh!
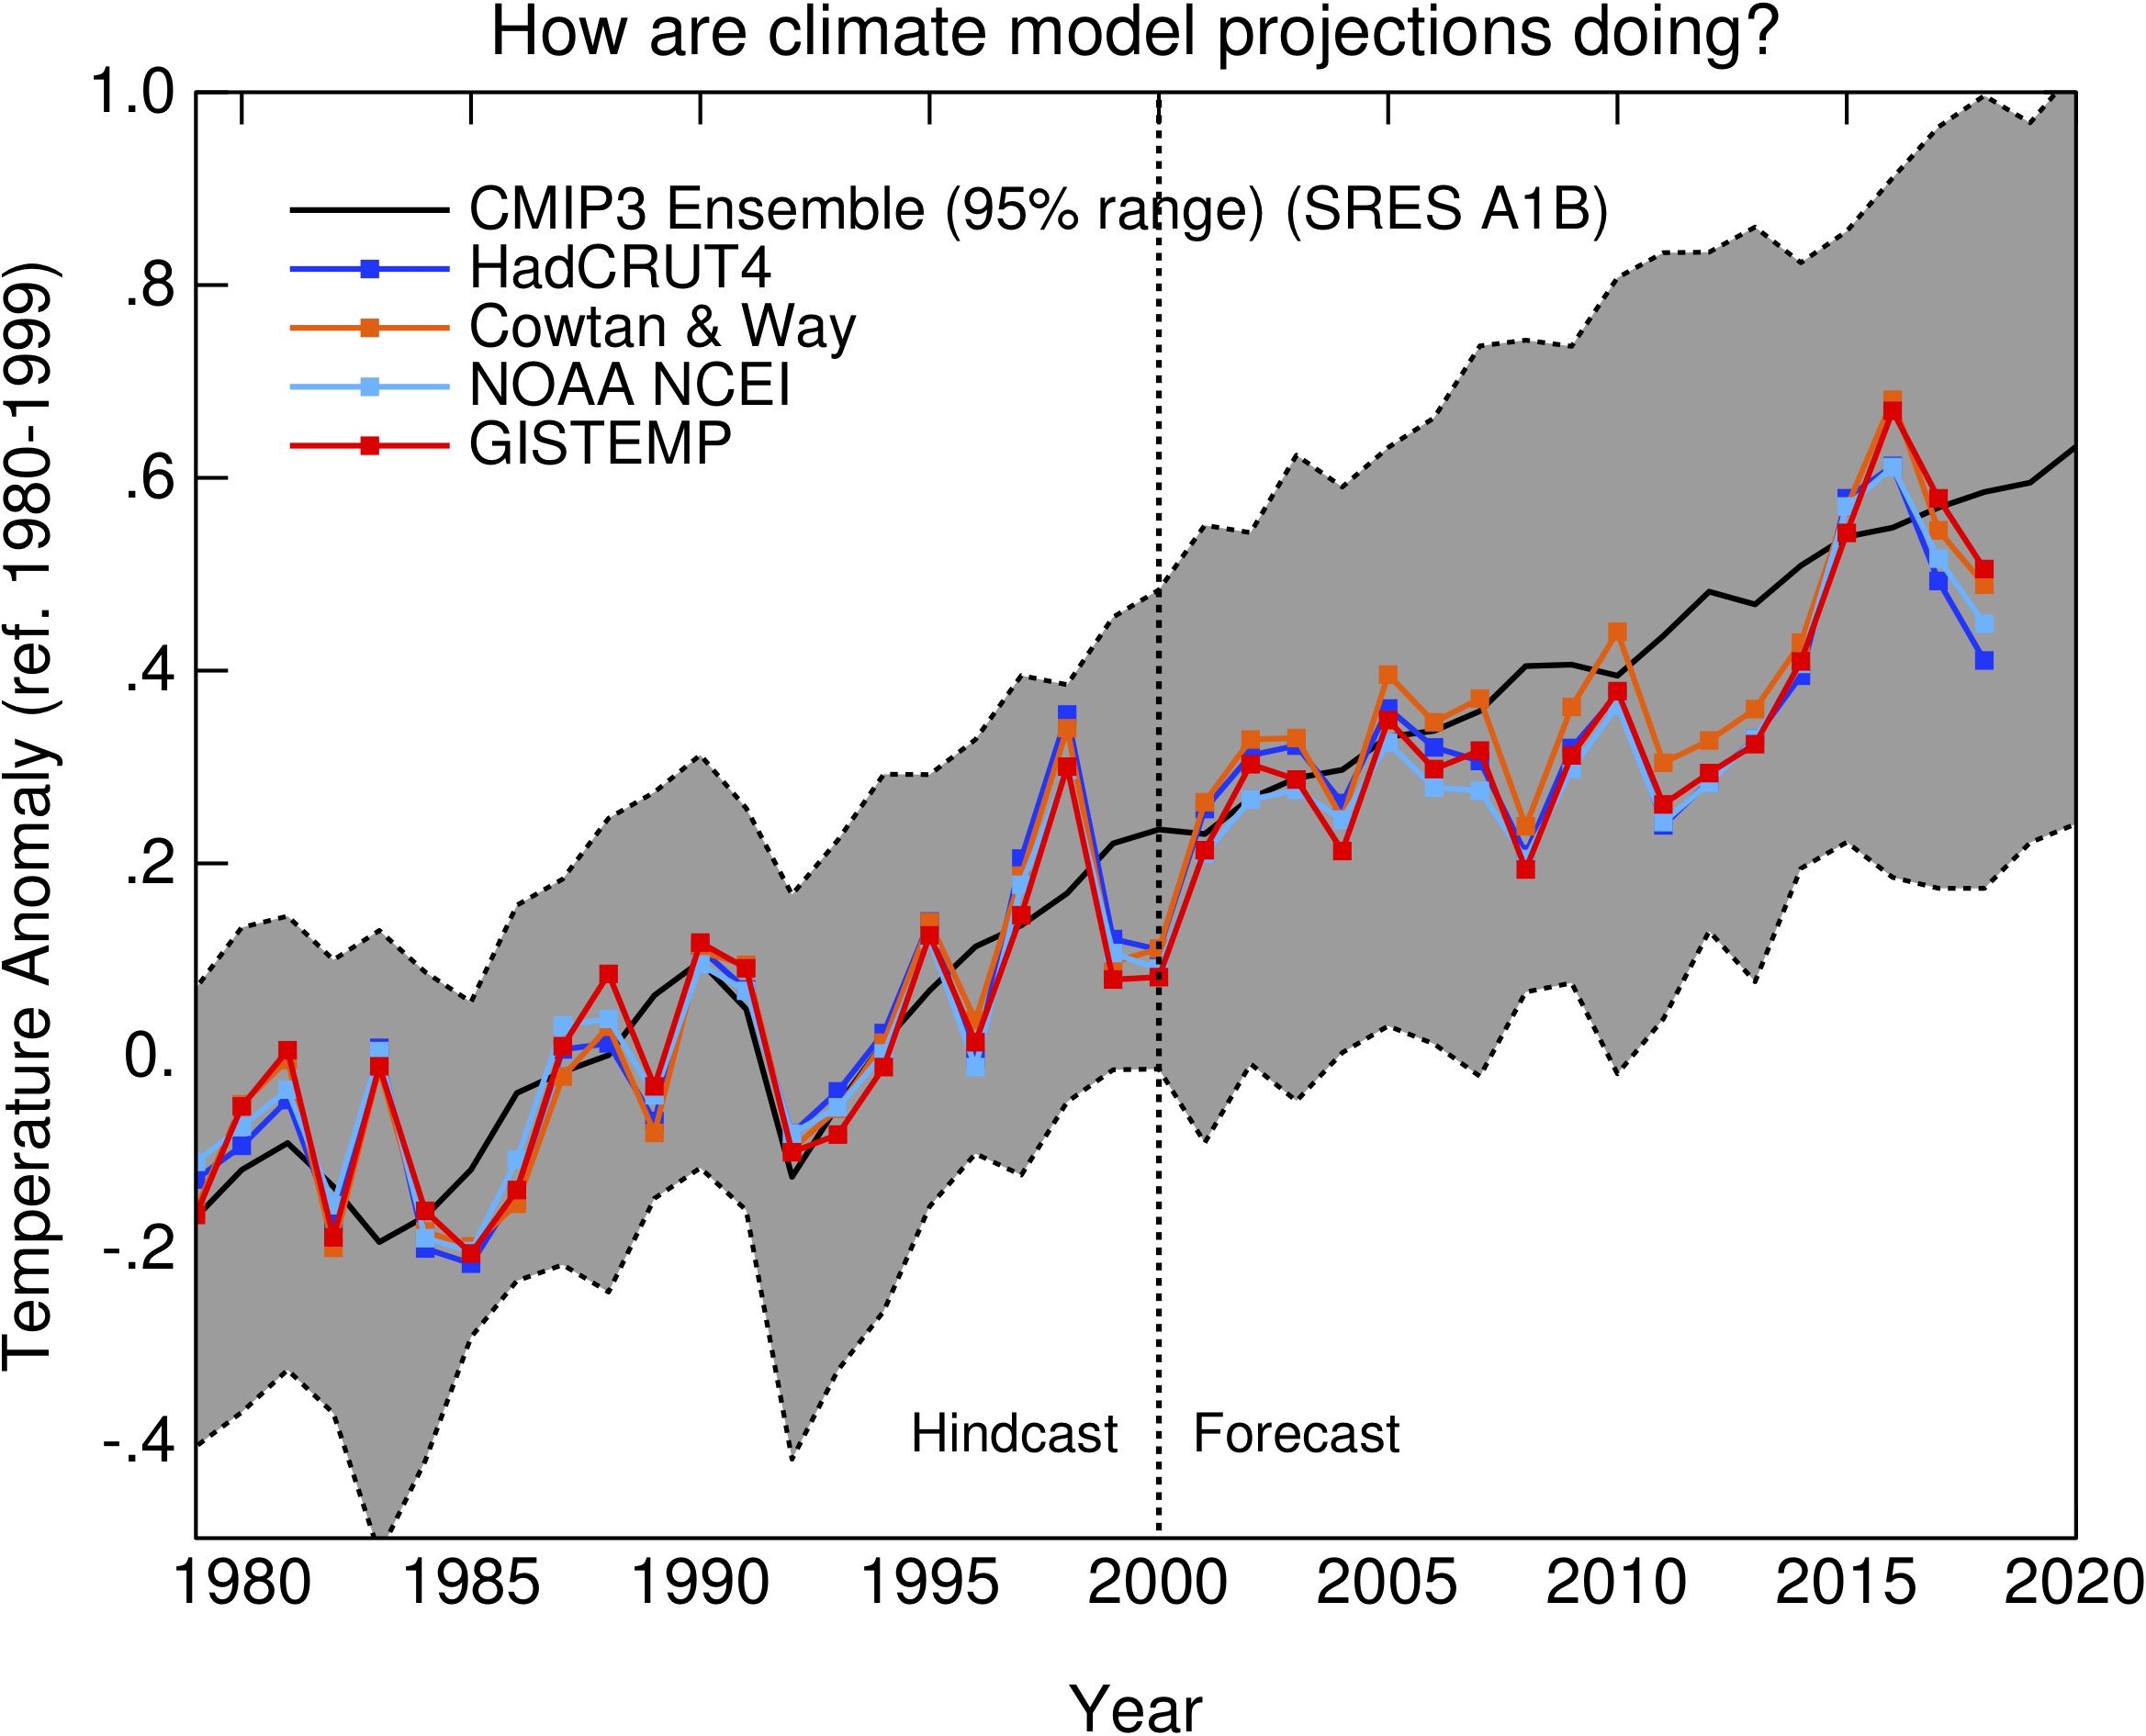
Its pretty fucked up that a chart posted by the head of NASA's GISS program is something you call 'propaganda', considering your sources.You know your propaganda piece entitled "How are climate model projections doing?"
It is a standard operating procedure in climate science to use a thirty year average as a reference baseline period
Do you own a mirror?
Still won't admit that your chart starts lower than zero, will you?Time to face some facts Frank, primarily the fact you lack the training, understanding, intelligence and just plain common sense to read a grade six level graph
Odd how you post graph after graph after graph in your comical attempt to mislead others, yet you cant read one
Talk about failure to read or understand sources, you take the cake here, mr science.
larueNot quite as sad as you not being able to read a grade six level temperature anomaly graph
You do not have the first loose clue about what you preach about
Despicable
Please tell me what the first and last values of your chart are.
Can you do it, can you read your own chart?
Quebec politician and radio talk show host Luc Ferrandez has suggested that the coronavirus has had one “positive” outcome for the city of Wuhan, China—it’s reduced the carbon footprint.
https://www.thepostmillennial.com/q...virus-for-reducing-carbon-footprint-in-wuhan/
this is the climate change cult 101
https://www.thepostmillennial.com/q...virus-for-reducing-carbon-footprint-in-wuhan/
this is the climate change cult 101
larue
Please tell me what the first and last values of your chart are.
Can you do it, can you read your own chart?
Oh I can read the chart, I paid attention in grade six
The first thing one does when reading a chart is to look at the reference labels to make sure you understand what information is available
The y axis reference is clearly stated,
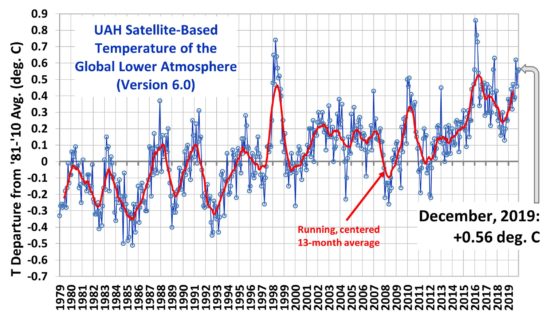
The last data point is 0.56 degrees difference from the charts zero reference line (the average of 1981 to 2010).
As per climate science standard operating procedure
John Christy added a clear label for that last point, just in case a simpleton might not understand. I guess he should have used bigger font for you
Time to face some facts Frank, primarily the fact you lack the training, understanding, intelligence and just plain common sense to read a grade six level graph
Odd how you post graph after graph after graph in your comical attempt to mislead others, yet you cant read one
perhaps you can get gretta to explain graph reading to you. I believe she got past grade six
you do not have the first clue about climate science or science in general,
your endless and irrational propaganda efforts just show other how messed up the alarmists are and how they are willing to lie and say anything to sell their apocalypse story
In your case it is even worse as you see climate change as the vehicle to impose socialism
too bad Frank, your wet dream is not going to happen
CLAIM: Climate Change Cited for Penguin Decline
CBS news recently reported a 50% decline in the number of chinstrap penguins residing on Elephant Island and a 75% decline of those living on Penguin Island all because of ….. drum roll please ….. global warming!
https://www.cbsnews.com/news/global...a-chinstrap-penguin-population-drops-by-half/
As the article above states, the nearly 3* C of global warming over the last 50 years caused a reduction of sea ice, which in turn results in a reduction of krill that eat the algae and other organisms that live underneath in the sea ice. As the krill population declines so does that of the chinstrap penguin since krill is their favorite food.
Ironically, the journal article below from a 1991 study claimed that the chinstrap penguin population increased during the 1900s *because* of global warming. So apparently global warming can both increase and decrease the penguin population. Wish the climate community would get their story straight!
https://marine.rutgers.edu/dmcs/ms606/2011 fall/Fraser et all 1992.pdf
Adding even more confusion, the following informational page from the Australian Department of Environment states that the chinstrap penguins have lower breeding success when there is more sea ice as it restricts access to the sea for foraging adults.
But the original CBS article says that more sea ice means more krill and a higher population of chinstrap penguins.
http://www.antarctica.gov.au/about-antarctica/wildlife/animals/penguins/chinstrap-penguins
So let’s sum this all up:
Global warming = decline in the # of chinstrap penguins
Global warming = increase in the # of chinstrap penguins
More sea ice = lower breeding success of chinstrap penguins
More sea ice = increase in the population of chinstrap penguins
So basically no matter what happens to the penguin population, climate change has all the bases covered. Expect anything different?
https://wattsupwiththat.com/2020/01/25/claim-climate-change-cited-for-penguin-decline/
Hey larue, why do you note the last value and refuse to use the first value?Oh I can read the chart, I paid attention in grade six
The first thing one does when reading a chart is to look at the reference labels to make sure you understand what information is available
The y axis reference is clearly stated,
The last data point is 0.56 degrees difference from the charts zero reference line (the average of 1981 to 2010).
Talk about cherry picking bullshit, you really take the cake here.
You've been caught, larue, you fucked up.
Just admit you're wrong, mr science.
1) Your chart shows more than 0.56ºC warming, as you falsely claimed
2) Your chart shows similar warming to the surface charts you called false.
Admit it, mr science, you're wrong.
climate change propaganda inducing mental distress among grown ups
Students and staff anxious about climate change are being offered therapy to tackle feelings of anger, guilt and grief.
University of Derby are running art therapy sessions for those suffering 'eco-anxiety' -an issue brought to the forefront of public attention by 17-year-old activist Greta Thunberg.
Participants are encouraged to express their feelings about climate change through 'poetry and movement'.
One student attending the therapy sessions, Claire Prowse, said climate change makes her feel like she is 'not going to have a future'.
She told the BBC: 'It makes me very anxious because every time I look at the news I rarely see any good news about the environment.
'It just makes me think I'm not going to have a future.'
https://www.dailymail.co.uk/health/...truggling-anxiety-climate-change-THERAPY.html
The only one pushing propaganda here is you, with your lunarplanner.com charts, faked news clippings from decades ago and stories funded by the oil industry.climate change propaganda inducing mental distress among grown ups
The question Canada Man refuses or can't answer:
In the 80's both Exxon and Shell's own internal scientists did their own oil funded research and they came up with the same predictions as the IPCC.
So how can those findings be biased?
Shell and Exxon's secret 1980s climate change warnings
Newly found documents from the 1980s show that fossil fuel companies privately predicted the global damage that would be caused by their products.
https://www.theguardian.com/environ...d-exxons-secret-1980s-climate-change-warnings
Because I figured anybody with a grade six level education or higher can read the first value , look at the defining parameters of the graph and quickly determine that 1979 was cooler than the reference period 1981 to 2010. That value was included only because that was the first data point in the data set (ie satellite data only goes back so far)Hey larue, why do you note the last value and refuse to use the first value?
Rational people would understand this, and not cry because the parameters of the graph have been defined and clearly labeled
Only Irrational or dishonest people would immediately jump to the conclusion that the author has tried to mislead
Too funny. It is not my fault you cannot read a simple chartTalk about cherry picking bullshit, you really take the cake here.
You have been shown you do not know how to read a grade six level chart and you claim I have been caught????You've been caught, larue, you fucked up.
Just admit you're wrong, mr science
1) Your chart shows more than 0.56ºC warming, as you falsely claimed
2) Your chart shows similar warming to the surface charts you called false.
Admit it, mr science, you're wrong.
Look
The science for climate is extremely complex
If you are unable to understand a well labelled grade six level temp anomaly graph, , it is time to admt, you are a scientific know nothing and stop preaching
The pictures only get more complicated
For instance the following three are very solid evidence against anthropogenic global warming and do not at all support the over-the-top alarmist view
Nor do they support your lame brain idea that socialism can prevent the apocalypse


Given you can not properly read a grade six level simple anolomly graph, you lack the understanding to provide any logical and honest counter argument
BTW the equations get far more difficult than the pretty pictures you do not understand
It is time for you to face some facts
You lack the understanding of simple basic science and are not at all suitable to lecture anyone on such a complex highly technical matter as climate
You will of coarse switch to character assassination and lies
Case closed!
So then a rationale person wouldn't read that chart and say that there was only 0.56C warming, as you did.Because I figured anybody with a grade six level education or higher can read the first value , look at the defining parameters of the graph and quickly determine that 1979 was cooler than the reference period 1981 to 2010. That value was included only because that was the first data point in the data set (ie satellite data only goes back so far)
Rational people would understand this, and not cry because the parameters of the graph have been defined and clearly labeled
Only Irrational or dishonest people would immediately jump to the conclusion that the author has tried to mislead
According to you, a rationale person, like me, would note that the first data point was at about -0.3ºC and that therefore the total warming is around 0.86ºC, not the 0.56º you claimed.
Thanks for pointing out that I am the rationale one here and that you are the dishonest one that tried to jump to a conclusion.
Yes, its very clear that the science is too complex for you to understand, no need to keep pointing this out.The science for climate is extremely complex
That's why its best to refer to smarter people who have studied the matter, like NASA and the IPCC.
Your charts are unsourced and contain no references to where the data comes from.For instance the following three are very solid evidence against anthropogenic global warming and do not at all support the over-the-top alarmist view
Nor do they support your lame brain idea that socialism can prevent the apocalypse
They are not worth even looking at until you can tell us where they come from, where their data comes from and what you think they are telling us.
After all, you've already told us that the science is too complicated for you to understand.
No a rational person would look at the axis label, understand the reference period and then look at the last labelled data point and realize that dta point was 0.56 C warmer than the 30 year average, as the author John Christy intended and clearly labelledSo then a rationale person wouldn't read that chart and say that there was only 0.56C warming, as you did.
Too funnyAccording to you, a rationale person, like me, would note that the first data point was at about -0.3ºC and that therefore the total warming is around 0.86ºC, not the 0.56º you claimed.
#1 you are not rational, slogans such as "The rich have a choice, pitchforks or taxes" prove that
I bet you can not find anyone else on this board who would use rational to describe you.
#2. that last data point is not 0.86C warmer than the stated 30 year reference period of the study, it is 0.56C warmer. This is a climate science standard.You DO NOT REFERENCE to a single data point as the volatility of the data means you can come up with an almost infinite number of values , which is useless
#3, For someone who claims to be an authority of climate change you should know this. Hence it is pretty clear you lack the intelligence to understand this subject matter
too funny. get back to us when some agrees that you are rationalThanks for pointing out that I am the rationale one here and that you are the dishonest one that tried to jump to a conclusion.
And nobody and I mean nobody would vouch for your honesty.
Too bad for you that your behaviour has so clearly defined your character
Your appeal to authority is proof positive you do not have a damn clue what you talk aboutYes, its very clear that the science is too complex for you to understand, no need to keep pointing this out.
That's why its best to refer to smarter people who have studied the matter, like NASA and the IPCC.
Come on. you portray your self as all knowing on this subject.
Don't hide behind authority.
Come on.Show us that you have not posted thousands of bullshit posts and explain what a scientific know-nothing thinks when he looks that those charts in post # 512
Not worth your trouble?
WellI guess the fate of the planet is not hanging the balance if it not worth the trouble for you to learn something
But you portray yourself as all knowing on this subject matterYour charts are unsourced and contain no references to where the data comes from.
They are not worth even looking at until you can tell us where they come from, where their data comes from and what you think they are telling us.
If that was the case you would recognise these charts and would be able to understand them
You are more than welcome to spend a bit time on google to locate them & you could finally EDUCATE yourself (to maybe a grade 10 level)
That should not be an imposition for someone who is saving the planet after all
A bold face lie by a pathological lairAfter all, you've already told us that the science is too complicated for you to understand.
I would never have said that
You really are pathetic
run away now
The first data point is -0.3ºC and the final data point is 0.56ºC.No a rational person would look at the axis label, understand the reference period and then look at the last labelled data point and realize that dta point was 0.56 C warmer than the 30 year average, as the author John Christy intended and clearly labelled
Your cherry picking is incredibly pathetic that you think its fine to note the last data point but think its dishonest to mention the first data point.
That slogan came from a group of millionaires, I posted the link to their site, mr science.Too funny
#1 you are not rational, slogans such as "The rich have a choice, pitchforks or taxes" prove that
If you want to argue that the Patriotic Millionaires aren't rationale, they're going come back and say obviously they are smarter and more rational than you, since they are rich and you aren't.
(since that appears to be your metric, not that its mine)
https://patrioticmillionaires.org/endorsed-bill-the-carried-interest-fairness-act/
The last data point is 0.86ºC warmer than the first data point. And I find it fucking hilarious that you say you shouldn't reference a single data point when you've already done that, you have already referred to the final, single data point, you just refuse to use the first data point as well.#2. that last data point is not 0.86C warmer than the stated 30 year reference period of the study, it is 0.56C warmer. This is a climate science standard.You DO NOT REFERENCE to a single data point as the volatility of the data means you can come up with an almost infinite number of values , which is useless
And if you're going to use the zero baseline as your reference you need to change your claim to match it. The proper claim is that your chart shows warming 0.56ºC two decades away from its zero baseline mid point. Which is more warming than the IPCC predicted and more warming than surface temperatures show.
Either way, using beginning and end points on your chart or your final number 20 years after the zero line, your chart shows just as much warming as the surface does which totally destroys your claims about there being no warming in the troposphere. So you might as well go back to talking about surface temperatures, since that bait and switch has failed miserably.
No, I say that the IPCC is the best source for the science on this subject.But you portray yourself as all knowing on this subject matter
That's why I refer to them and their work.
I just understand the subject much better than you do, since you keep saying its too complicated for you to understand and can't tell legitimate sources from bullshit ones due to your confirmation bias.
Congress has given NOAA money to study ways to pollute the atmosphere in order to stop “global warming”
https://www.scientificamerican.com/article/noaa-gets-go-ahead-to-study-controversial-climate-plan-b/
Record cold is being blamed on global warming, and experts want to make it even colder by blocking sunlight, and restricting availability of fossil fuels.
The plan is to run the world off solar panels while polluting the atmosphere, and thus reduce the amount of sunlight available to those solar panels. And in the process, cut down tens of millions of trees to make room for the solar panels.
https://docs.wind-watch.org/Scottish-Forestry-FoI-19-02646.pdf
Forty-five years ago, climatologists wanted to melt the Arctic ice cap in order to save the world from global cooling.
http://www.denisdutton.com/newsweek_coolingworld.pdf
People fought hard for the Clean Air Act, and now Congress wants to pollute the atmosphere in order to stop an imaginary problem blamed on non-pollutant CO2. A cheaper and safer solution would be to instruct NOAA to stop tampering with the data.
https://realclimatescience.com/wp-content/uploads/2020/01/USMeasuredVsAdjusted.gif
Exposed: Greta's school strike sham, from Al Gore to her bodyguards | Keean Bexte
https://www.youtube.com/watch?v=SPn4928wKqQ
the man who found her is linked to Al Gore and Greta's School does not take attendance and kids are allowed to skip school
https://www.youtube.com/watch?v=SPn4928wKqQ
the man who found her is linked to Al Gore and Greta's School does not take attendance and kids are allowed to skip school
Harassing a 16 year old. This Rebel Reporter is what is called a real "Right Wing Hack"!!Exposed: Greta's school strike sham, from Al Gore to her bodyguards | Keean Bexte
https://www.youtube.com/watch?v=SPn4928wKqQ
the man who found her is linked to Al Gore and Greta's School does not take attendance and kids are allowed to skip school
Even now Trump's own Treasury member's wife supports Great Thunberg over her husband's Climate Change Denial:
Louise Linton sides with Greta Thunberg after husband Steve Mnuchin takes jab at climate crisis activist:
Treasury Secretary Steve Mnuchin's wife Louise Linton on Saturday showed support for climate activist Greta Thunberg, days after her husband took a jab at the teenager.
Mnuchin was dismissive of the 17-year-old Swedish climate activist at the World Economic Forum in Davos, Switzerland, and said Thunberg should go study economics in college before weighing in on US policies and how they relate to the climate crisis.
A post on Linton's verified Instagram account, which has since been deleted, reads, "I stand with Greta on this issue. (I don't have a degree in economics either) We need to drastically reduce our use of fossil fuels. Keep up the fight @gretathunberg."
CNN has reached out to Linton about the deleted post and the Treasury Department for comment from Mnuchin.
Linton has kept a relatively low profile since a controversy in 2017 where she apologized after sustained backlash for a now-deleted Instagram post touting her wealth and her subsequent reply belittling a commenter.
Linton's support of Thunberg stands in stark contrast to comments made by her husband days prior.
In Davos, a reporter asked Mnuchin, "Greta Thunberg has called for a public and private sector divestment from fossil fuel companies. Does that pose a threat to US economic growth?"
"Is she the chief economist, or who is she? I'm confused," Mnuchin replied. "It's a joke. After she goes and studies economics in college she can come back and explain that to us."
Thunberg, who also spoke at the World Economic Forum in Davos, responded on Twitter, "My gap year ends in August, but it doesn't take a college degree in economics to realise that our remaining 1,5° carbon budget and ongoing fossil fuel subsidies and investments don't add up."
"So either you tell us how to achieve this mitigation or explain to future generations and those already affected by the climate emergency why we should abandon our climate commitments," Thunberg wrote.
Thunberg became the youngest individual to be named Time magazine's Person of the Year in December after inspiring climate protesters worldwide. She gained international attention for condemning world leaders for not doing enough to combat the global climate crisis in a viral speech she made at the UN Climate Action Summit in September.
Thunberg has also been a target of President Donald Trump
Trump attacked climate activists as "perennial prophets of doom" at the World Economic Forum, where the agenda was focused on tackling the climate crisis. Trump's remarks underscored the chasm between his view on the climate crisis and the overwhelming scientific consensus driving the rest of the developed world to action.
The Trump administration has rolled back key environmental regulations, and Trump withdrew from the Paris climate accord, a landmark effort to reduce global greenhouse gas emissions.
https://www.cnn.com/2020/01/25/polit...erg/index.html
investigating a fraud and a liar is not harassing. CBC and CTV all have similar investigative reporting programsHarassing a 16 year old. This Rebel Reporter is what is called a real "Right Wing Hack"!!
